

The Investment
How It Works
mira is welcoming investment at a ฿48,000,000 valuation — Phases 1–3, the 6 villas on the first half of the land. Minimum ticket: ฿6,000,000 → 12.5% equity, with larger tickets scaling pro-rata (equity = investment ÷ ฿48M) up to a maximum of 49% equity — the founding team retains majority ownership. Invest and receive a proportional ownership stake — entitling you to quarterly dividend distributions from rental income for the life of the leasehold.
At ฿48M valuation → 12.5% of the 6-villa portfolio
Base case: 20.1% blended net return per stabilized year
e.g. ฿12M → 25% · maximum ฿23.52M → 49%
Same return profile — use the calculator below
Portfolio Status
6 Luxury Villas — Three Phases
2026 fixed ADR: ฿9,000/night minimum.
Renting from October 2026 at ฿12,000/night.
Target ADR: ฿12,000/night. Funded by this raise + cashflow.
Revenue Timeline — Active Villas by Year
P2 opens Oct
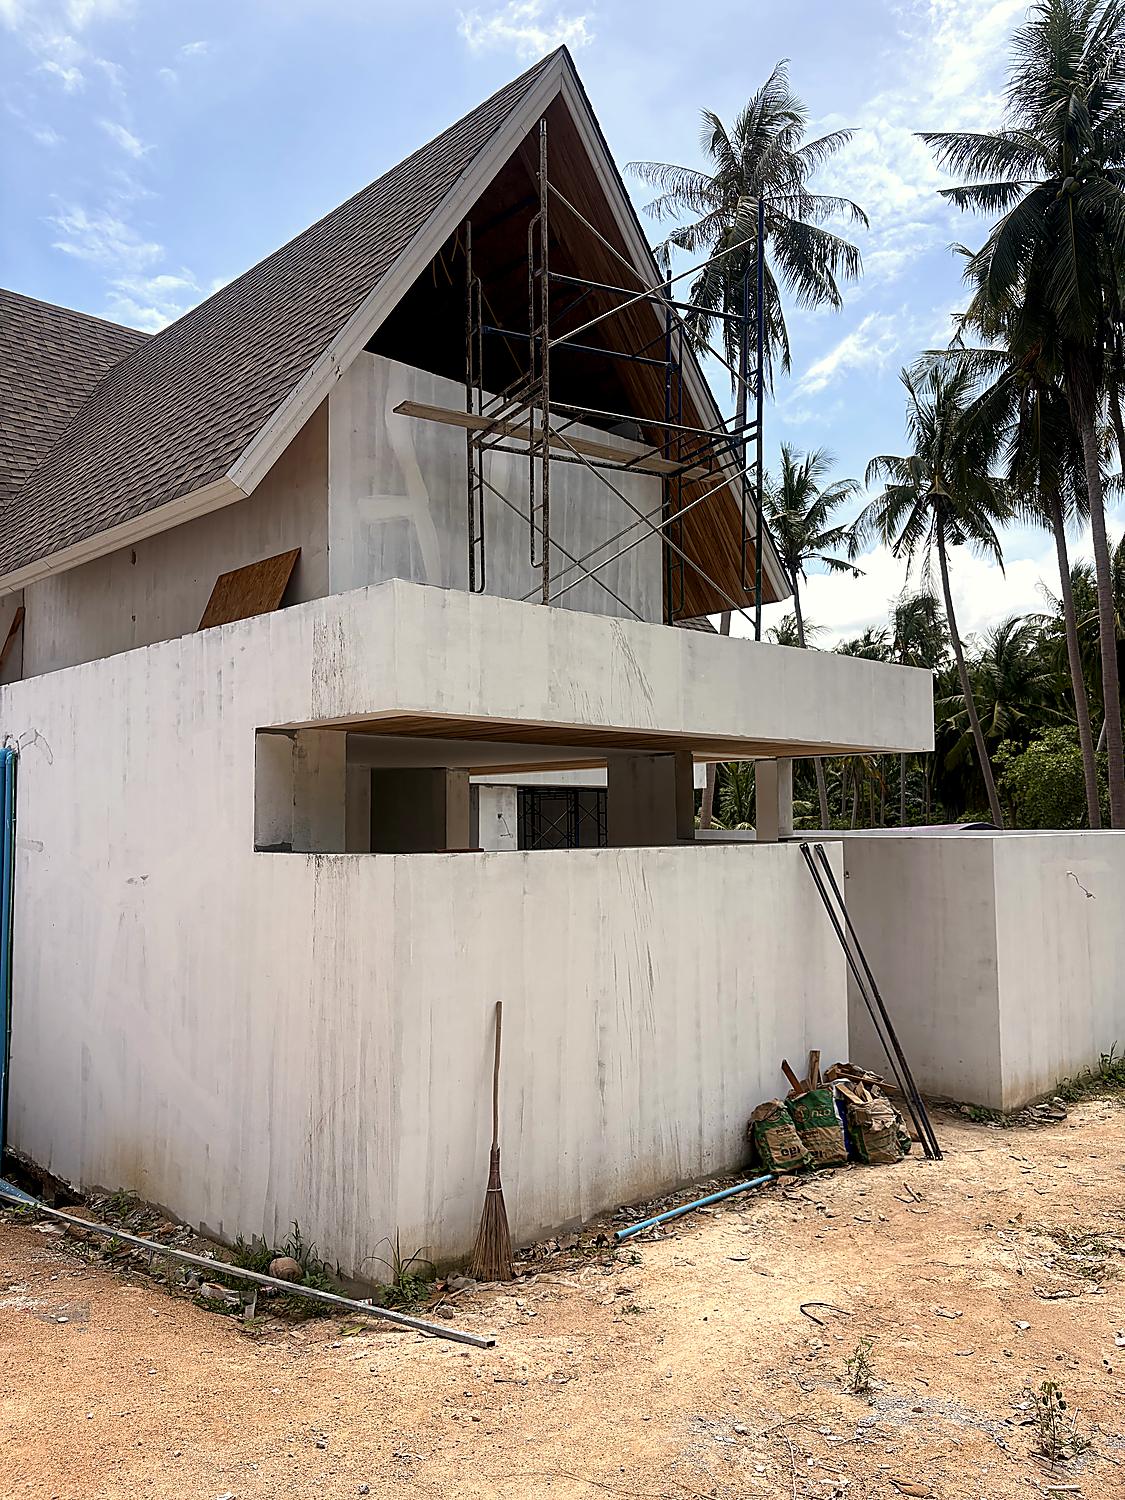
P3 in construction
All 6 online
operations
cash flow
Phase 3 timeline assumes construction begins after this raise closes (~Q4 2026); the build takes approximately 1 year from start, with both villas online from 2028.
The Villas
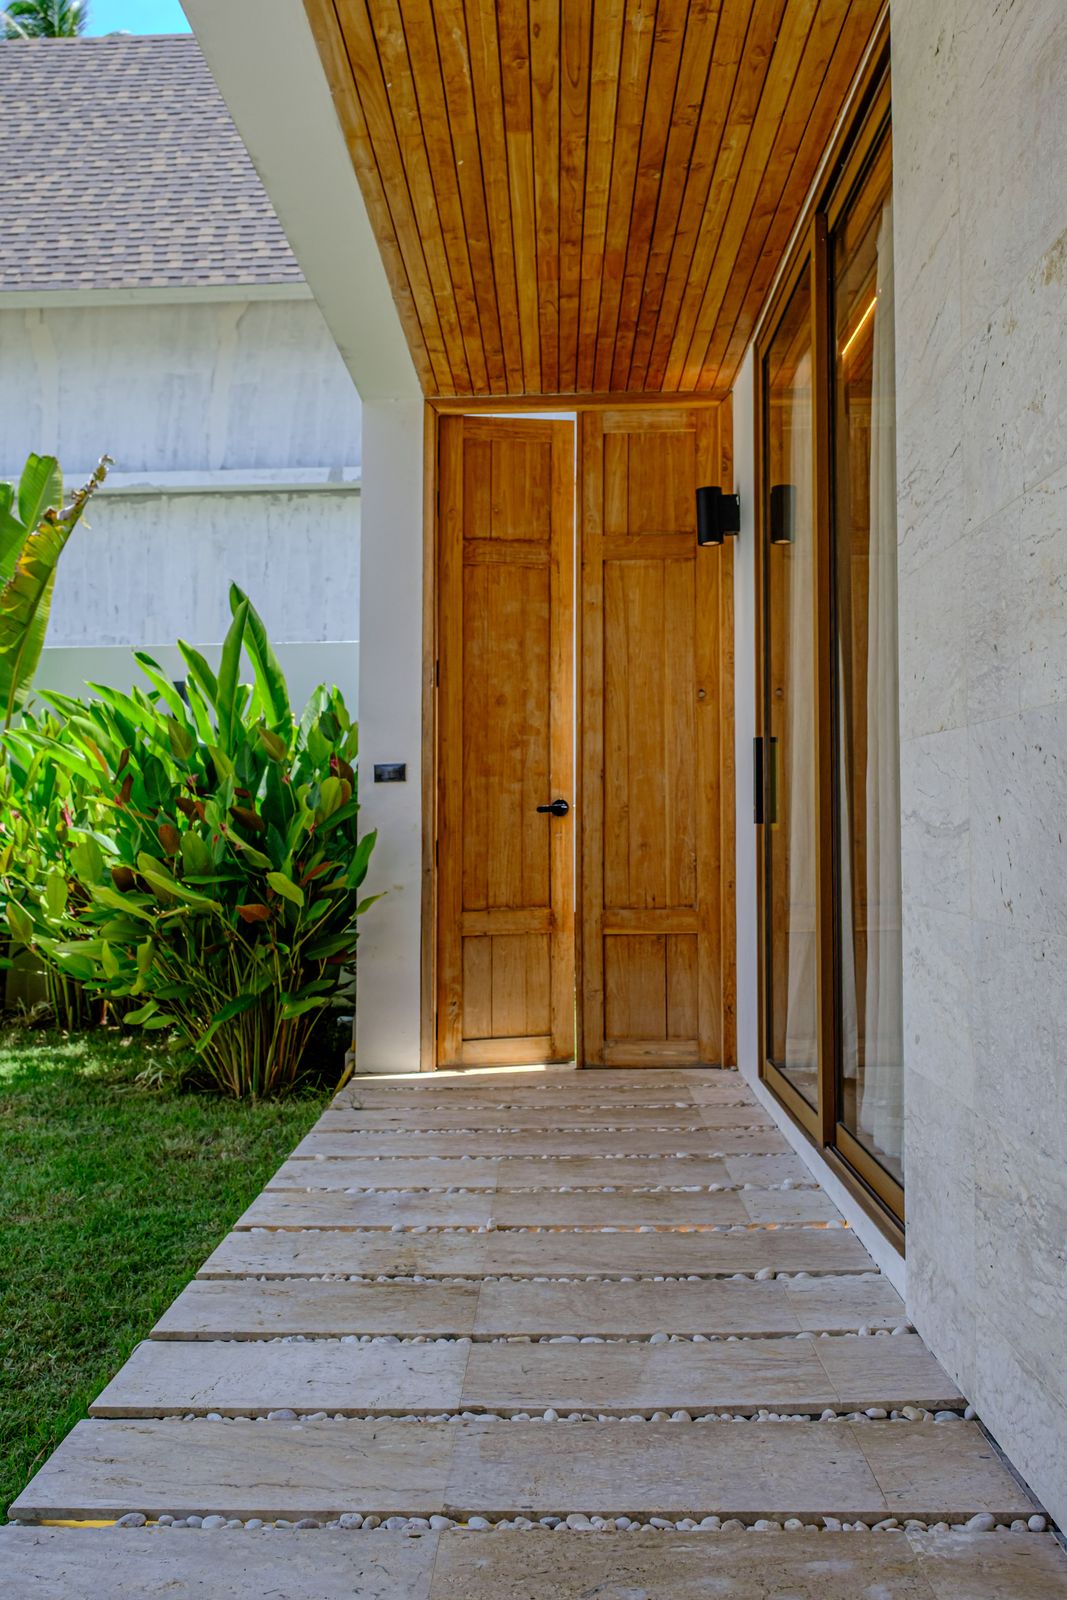
Inside mira
Drag to explore →
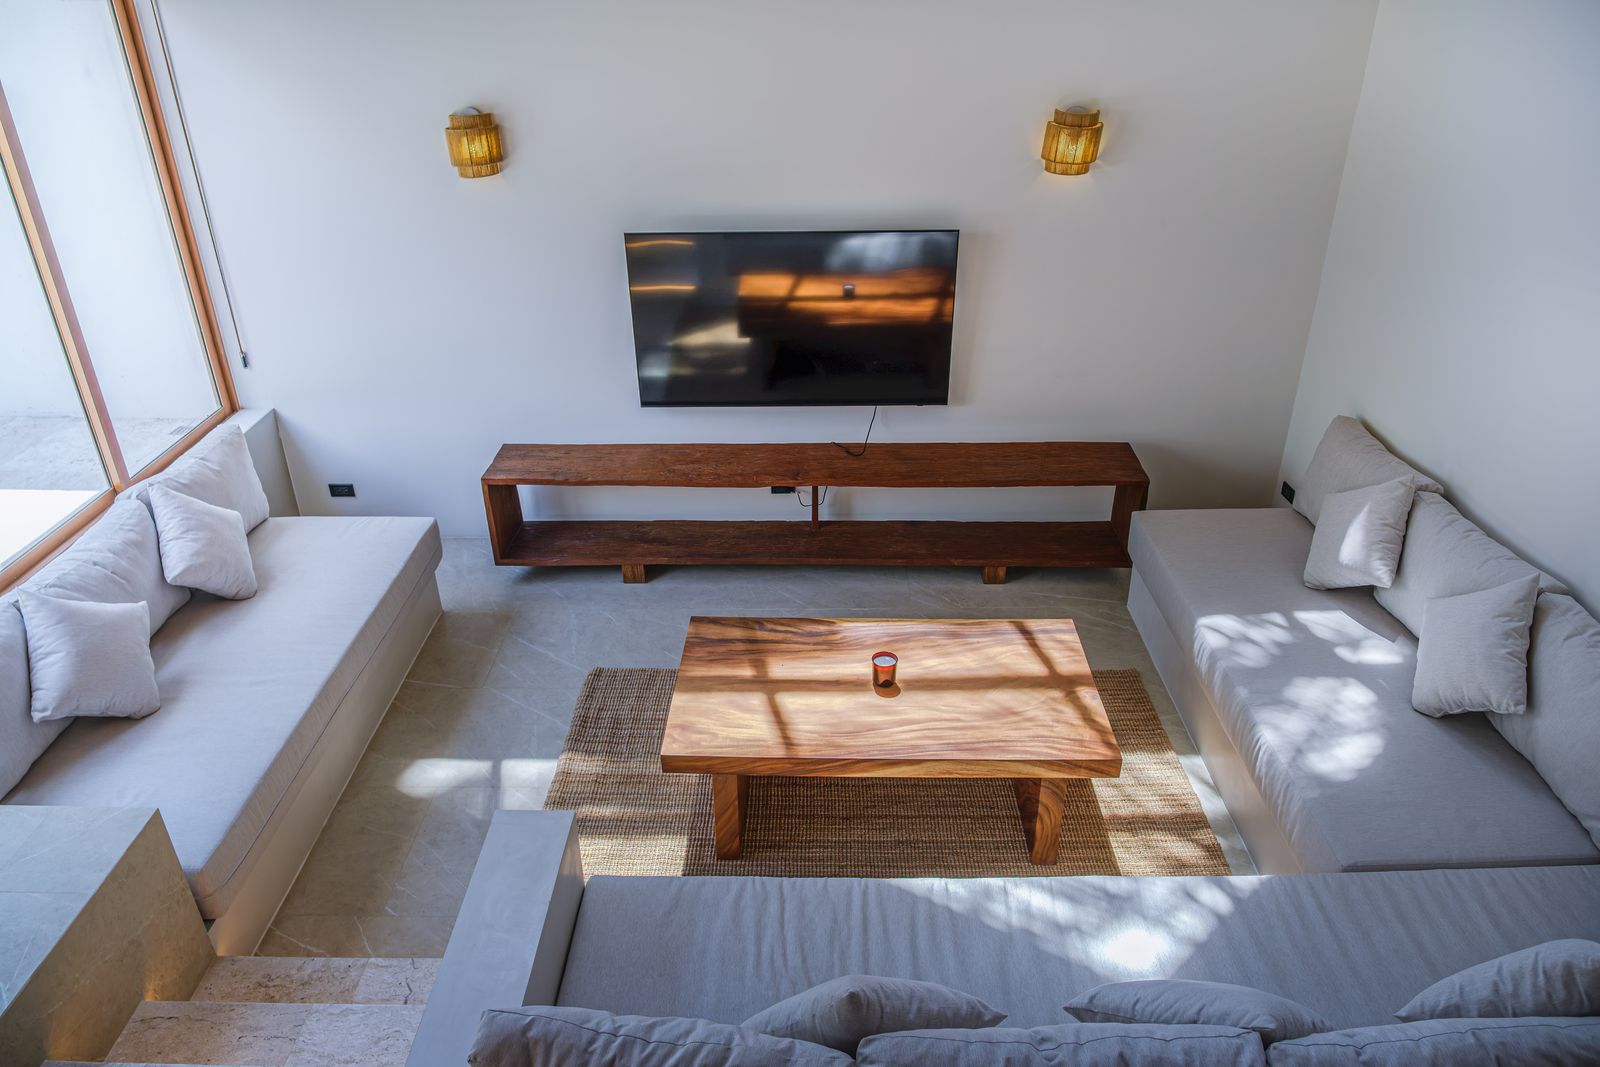
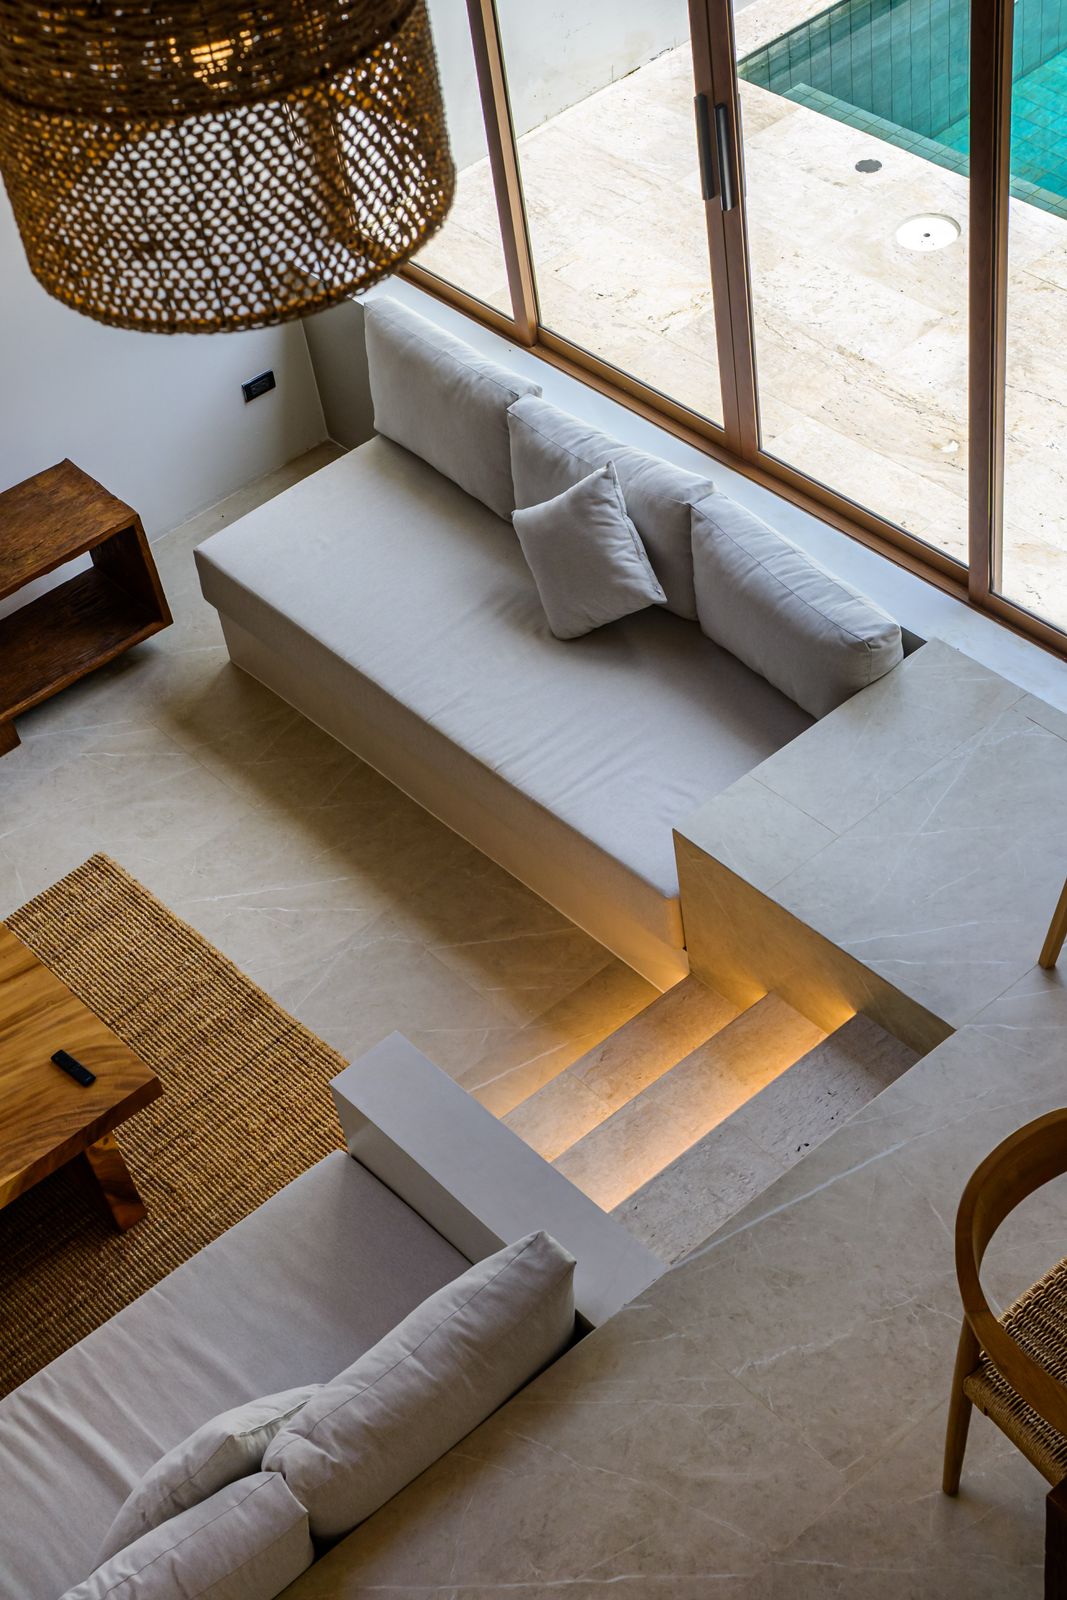
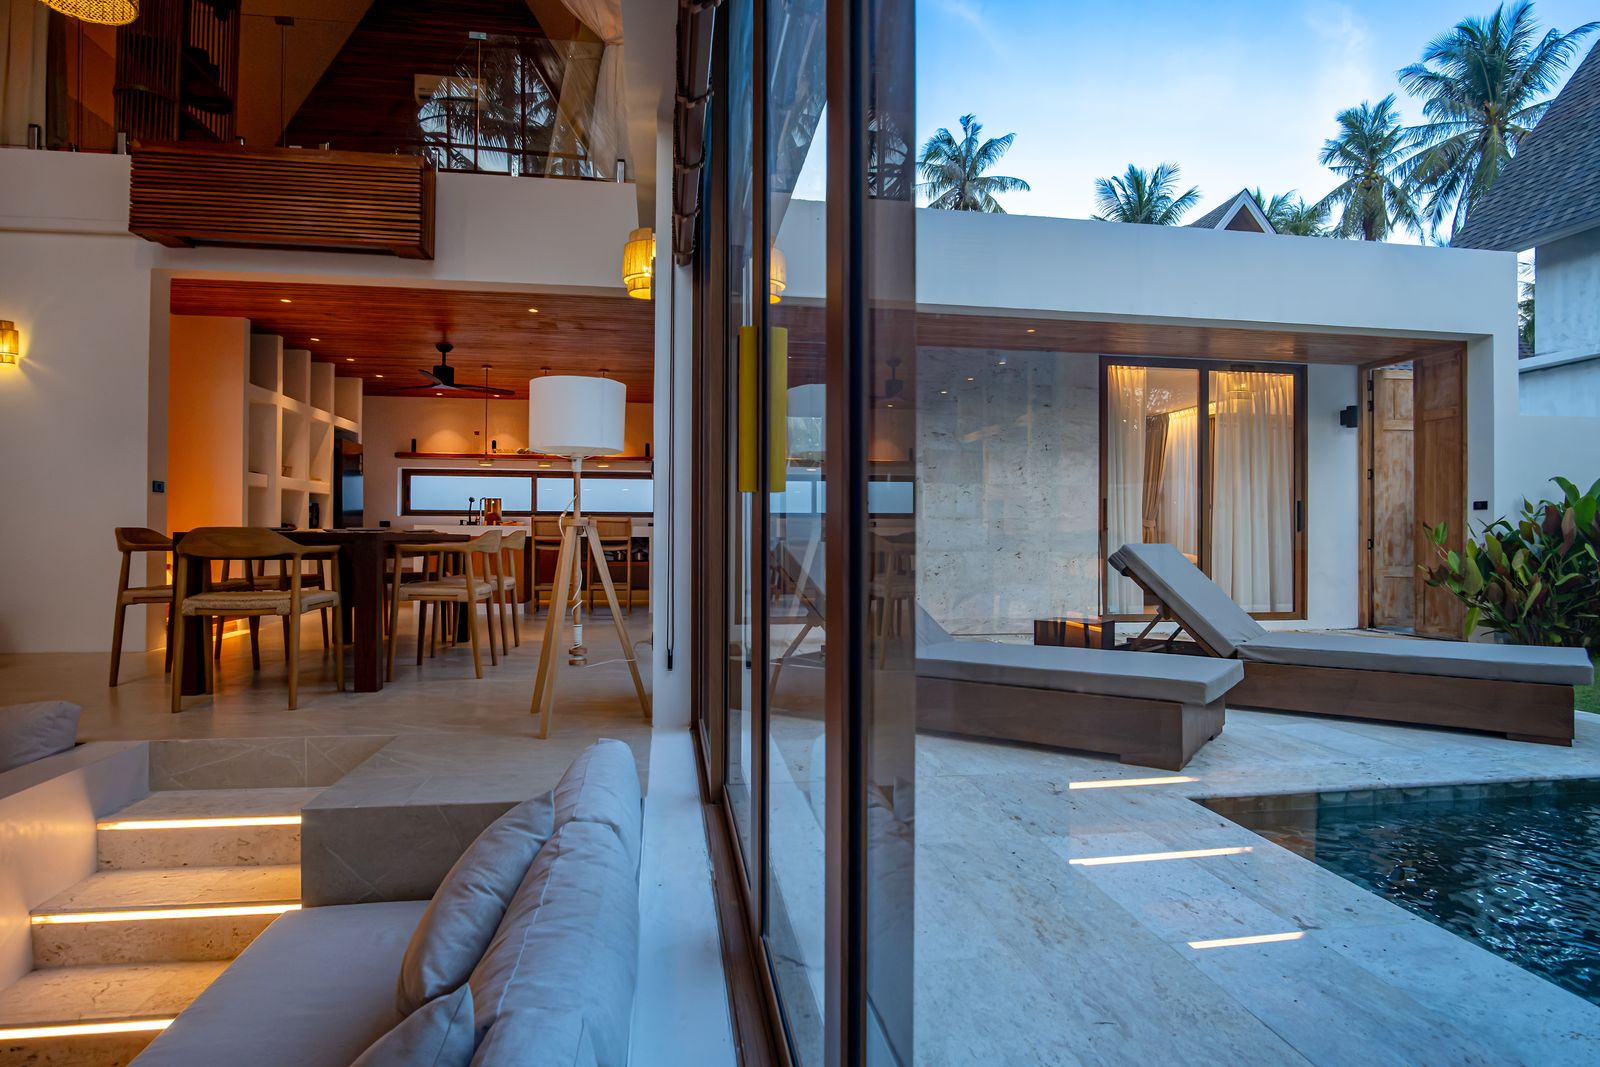
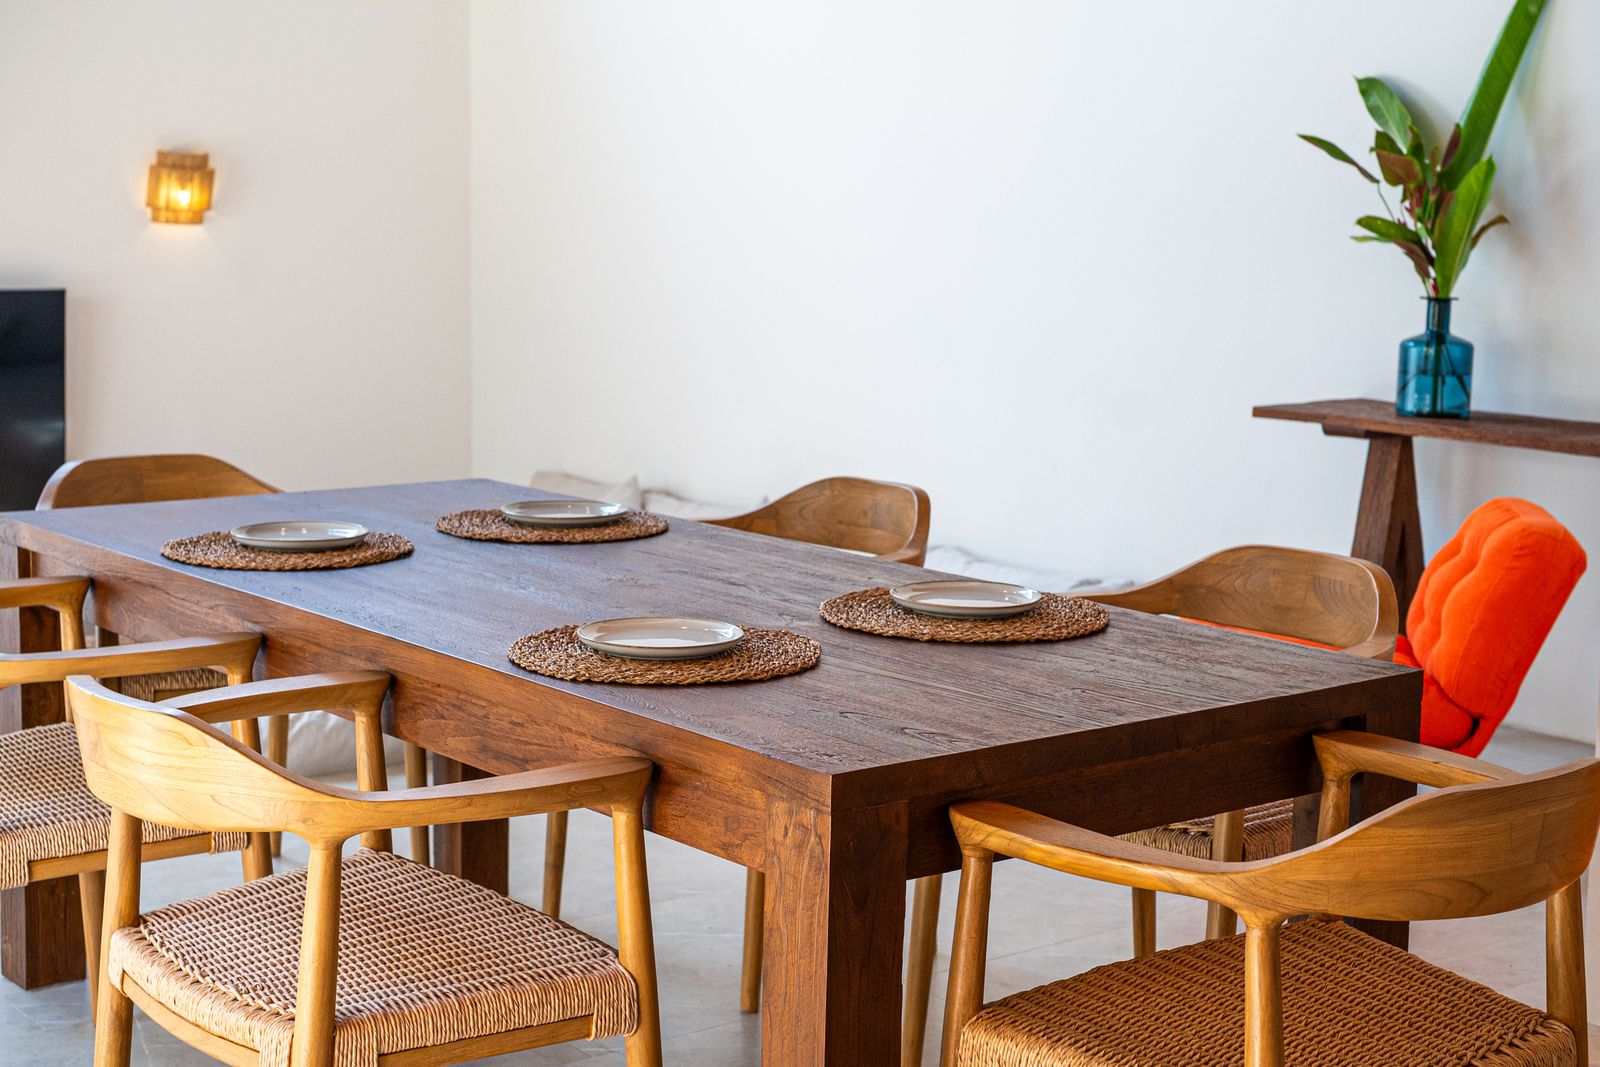
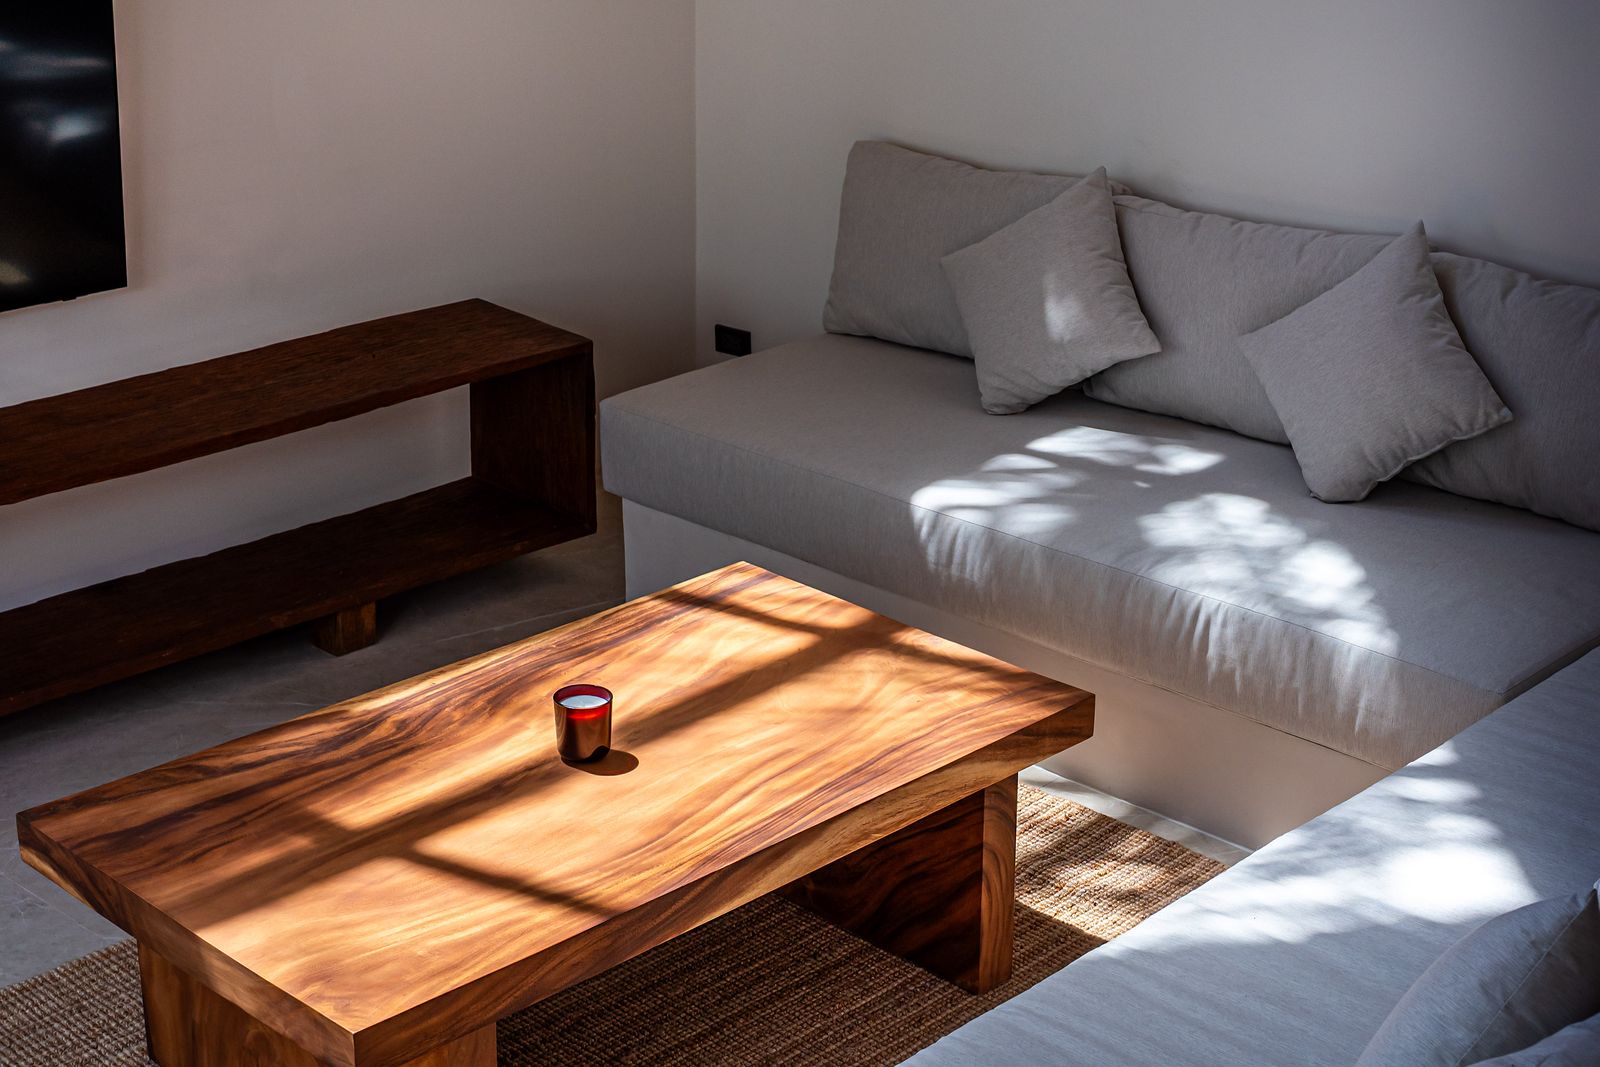
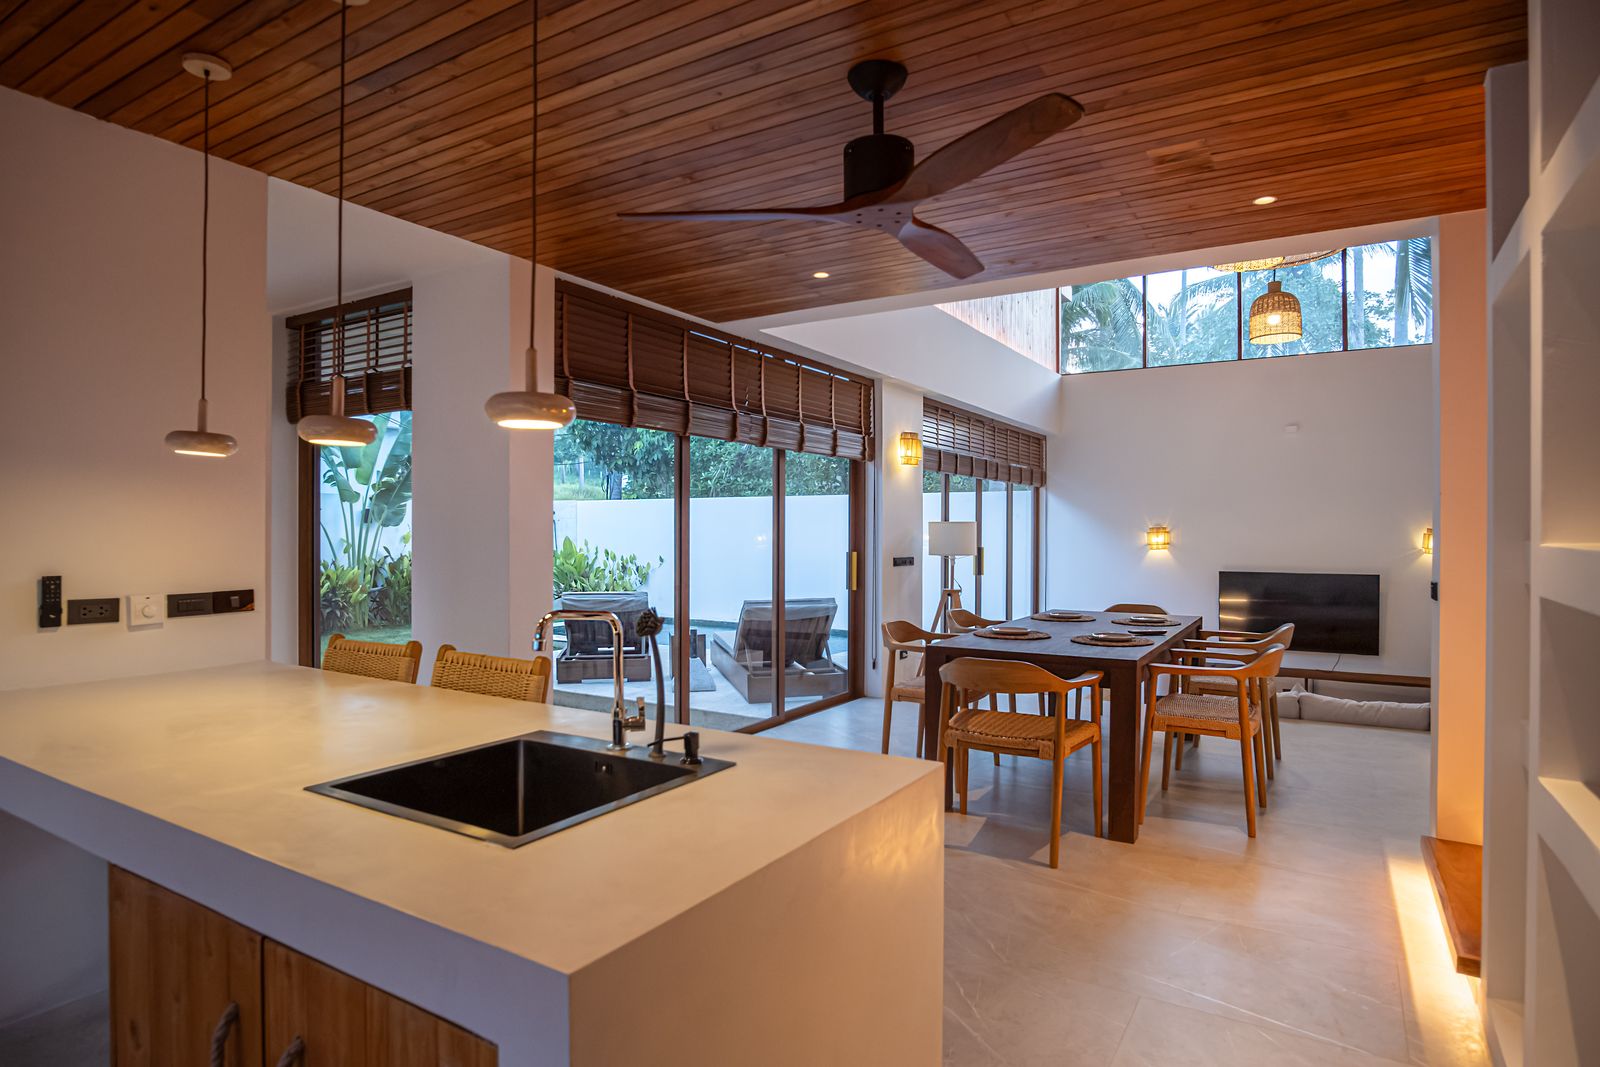
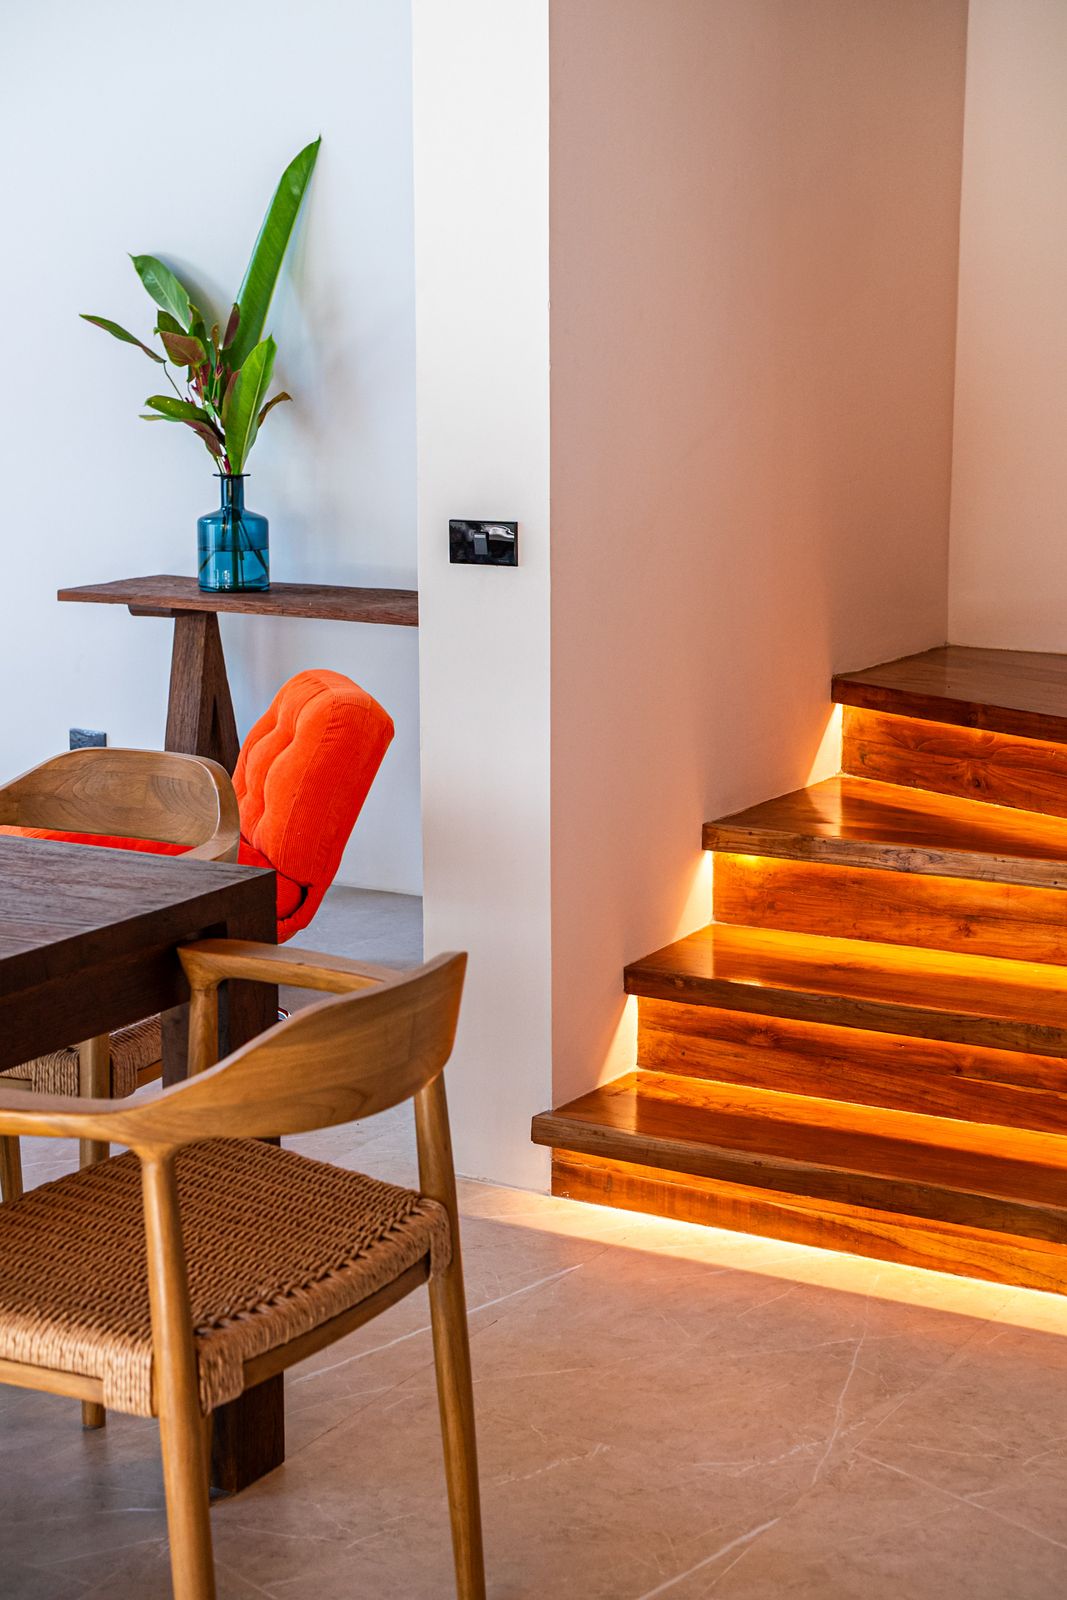
Living & Dining
10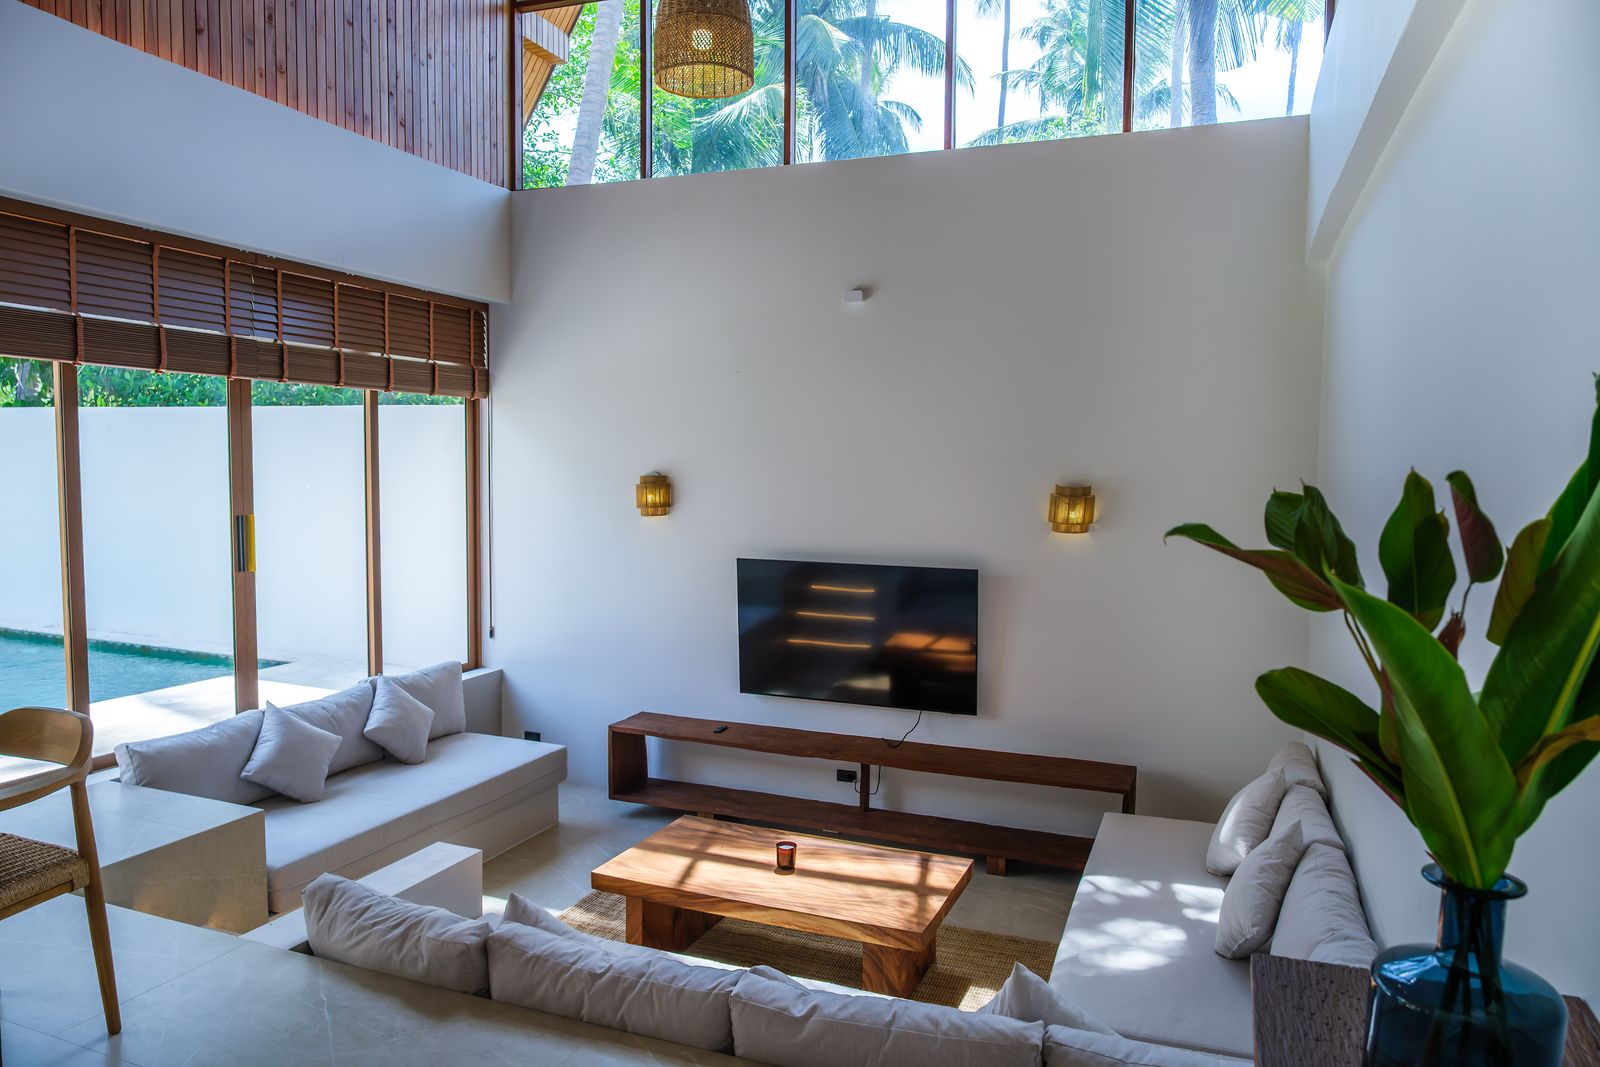
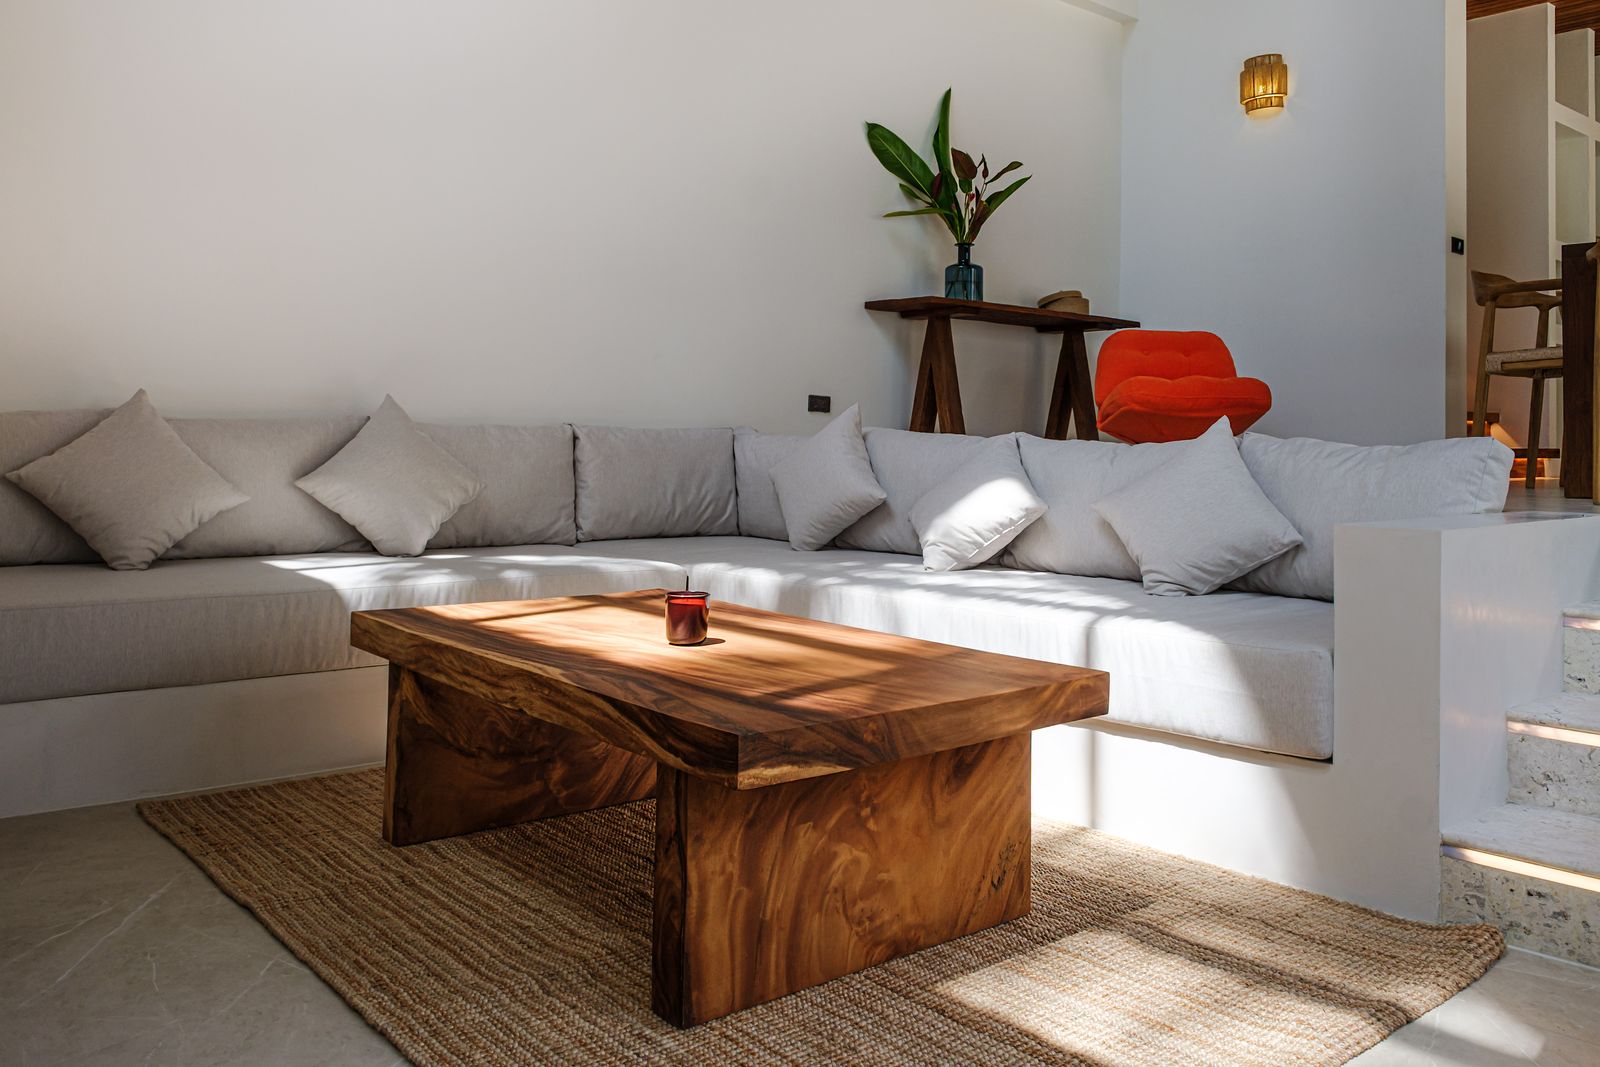
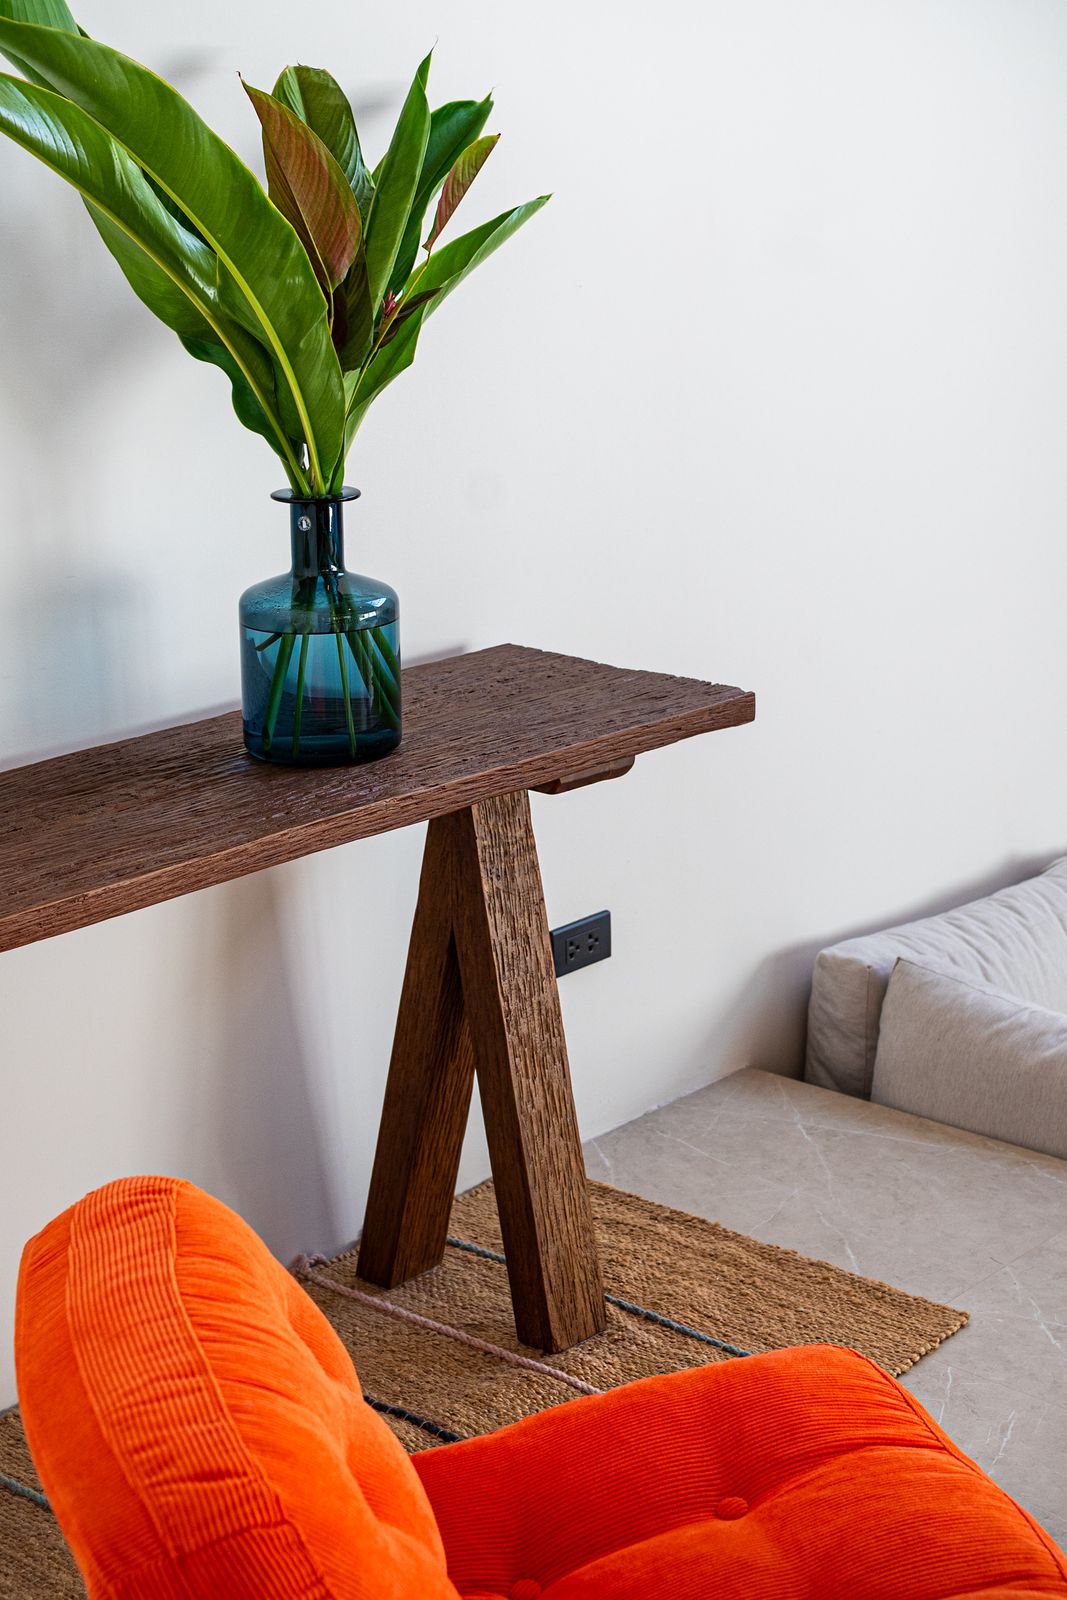
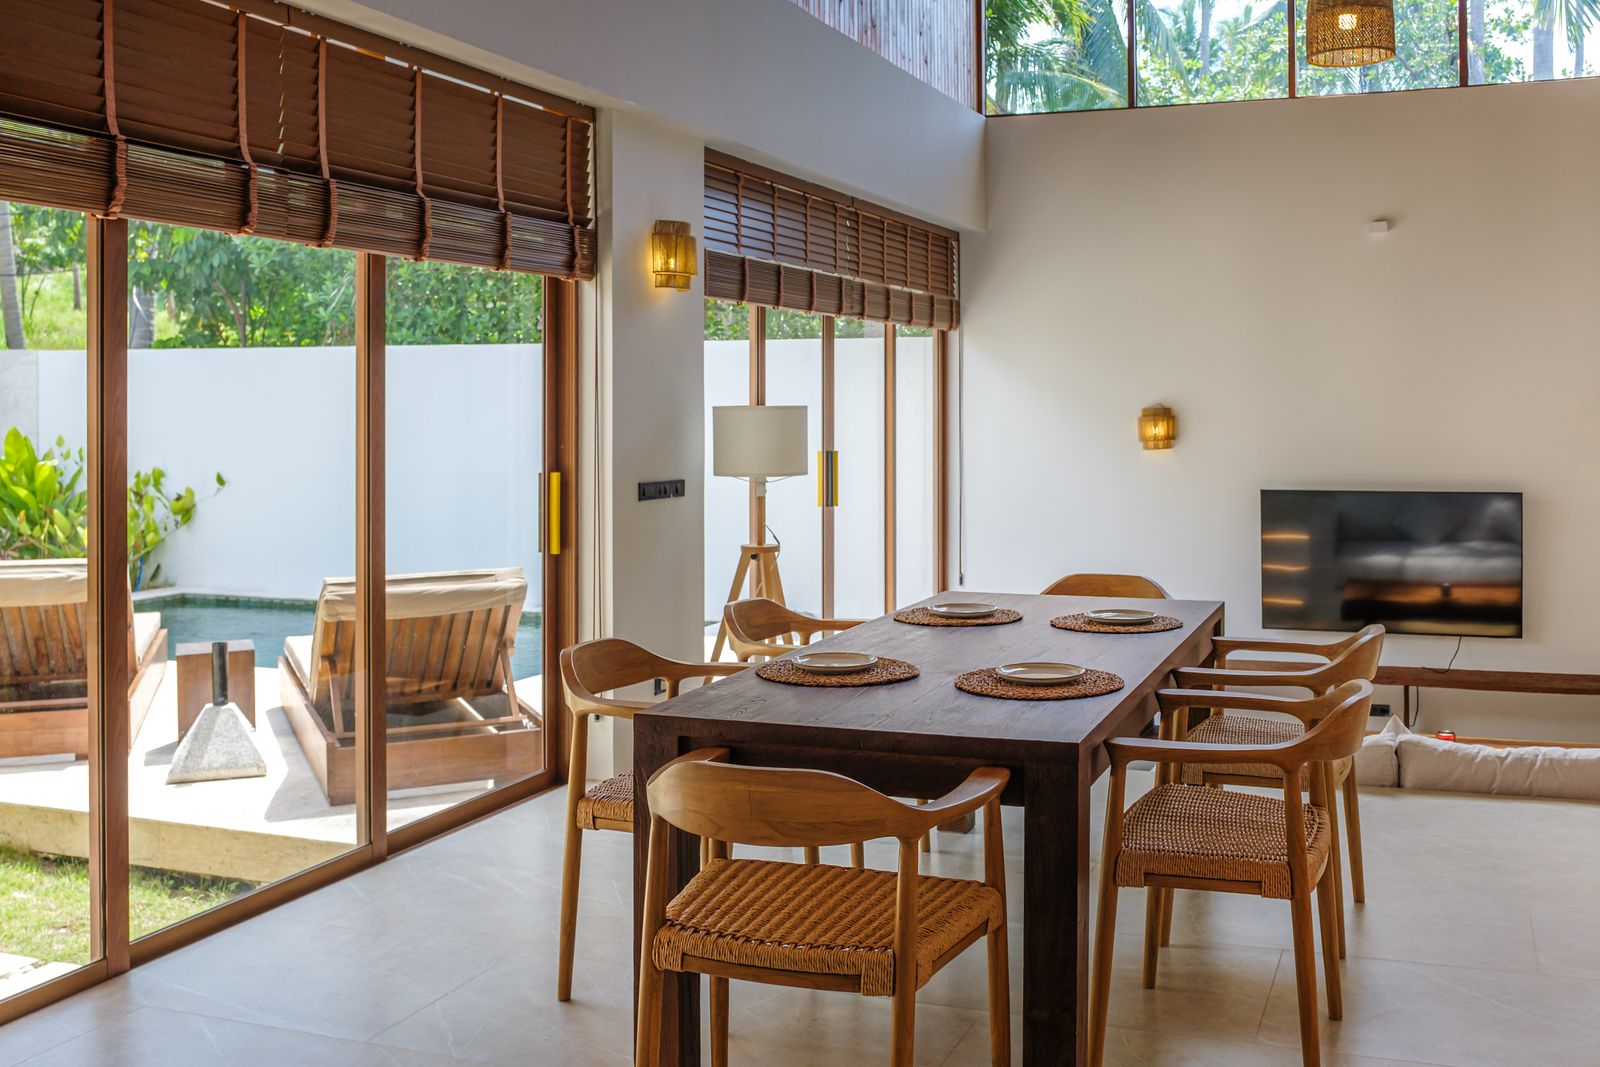
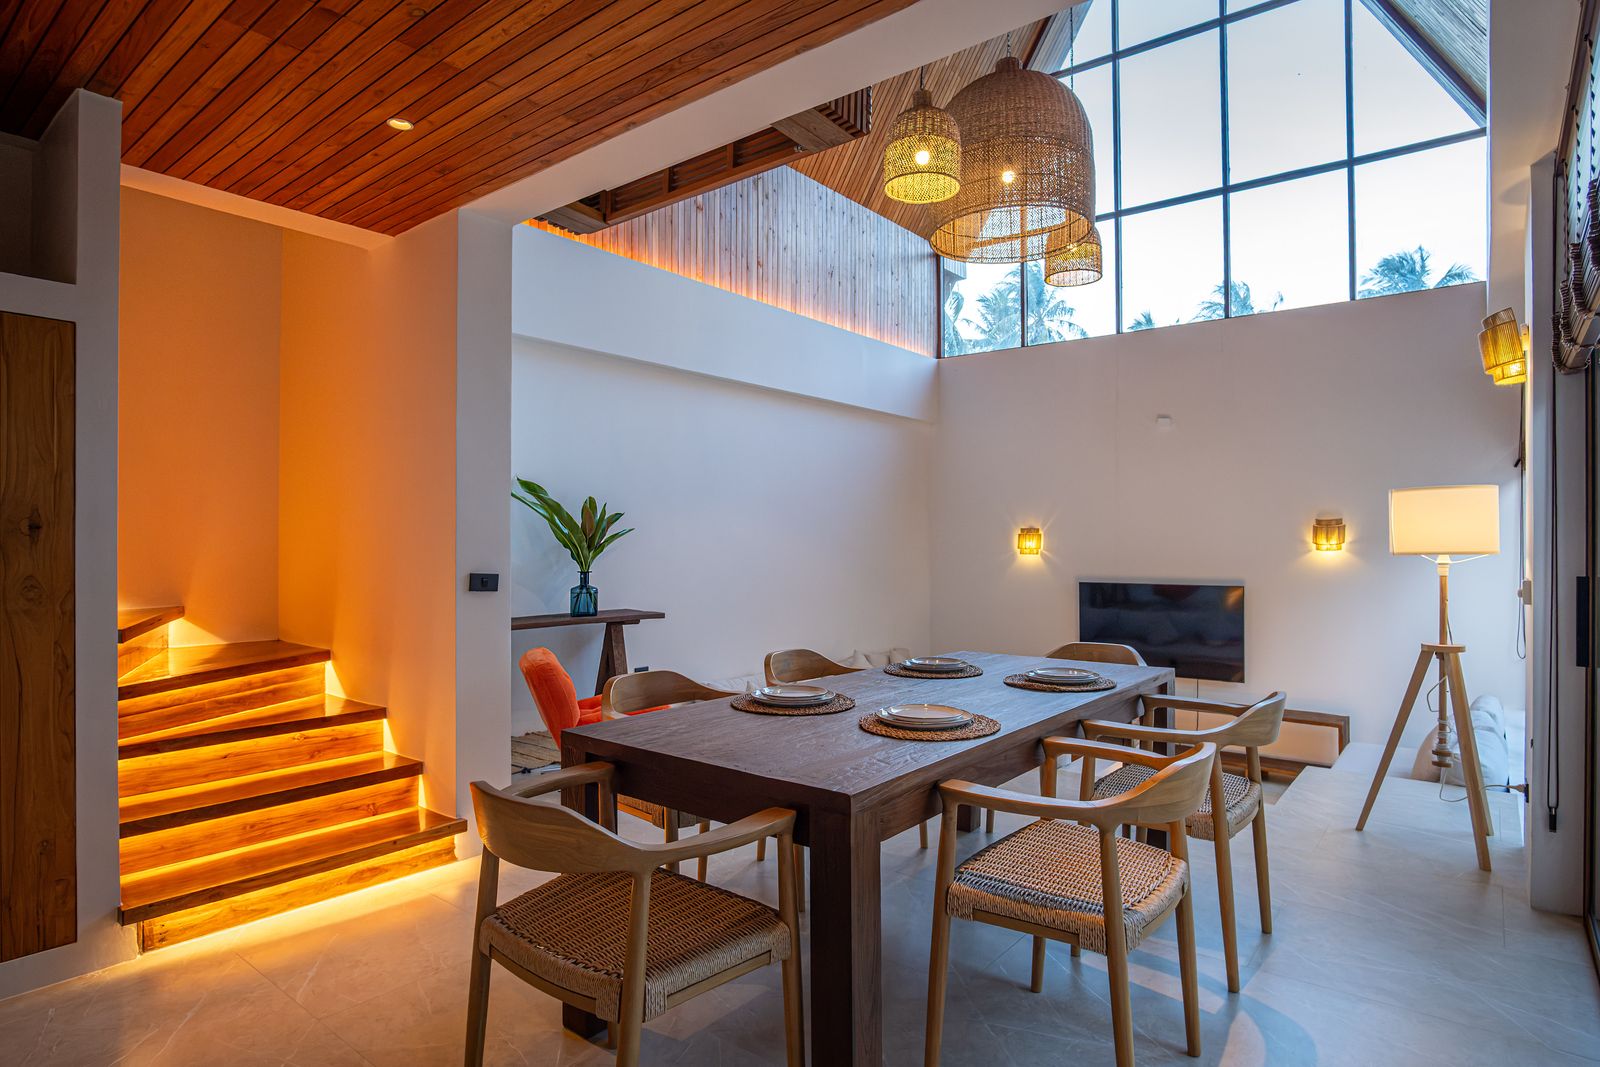
Kitchen
03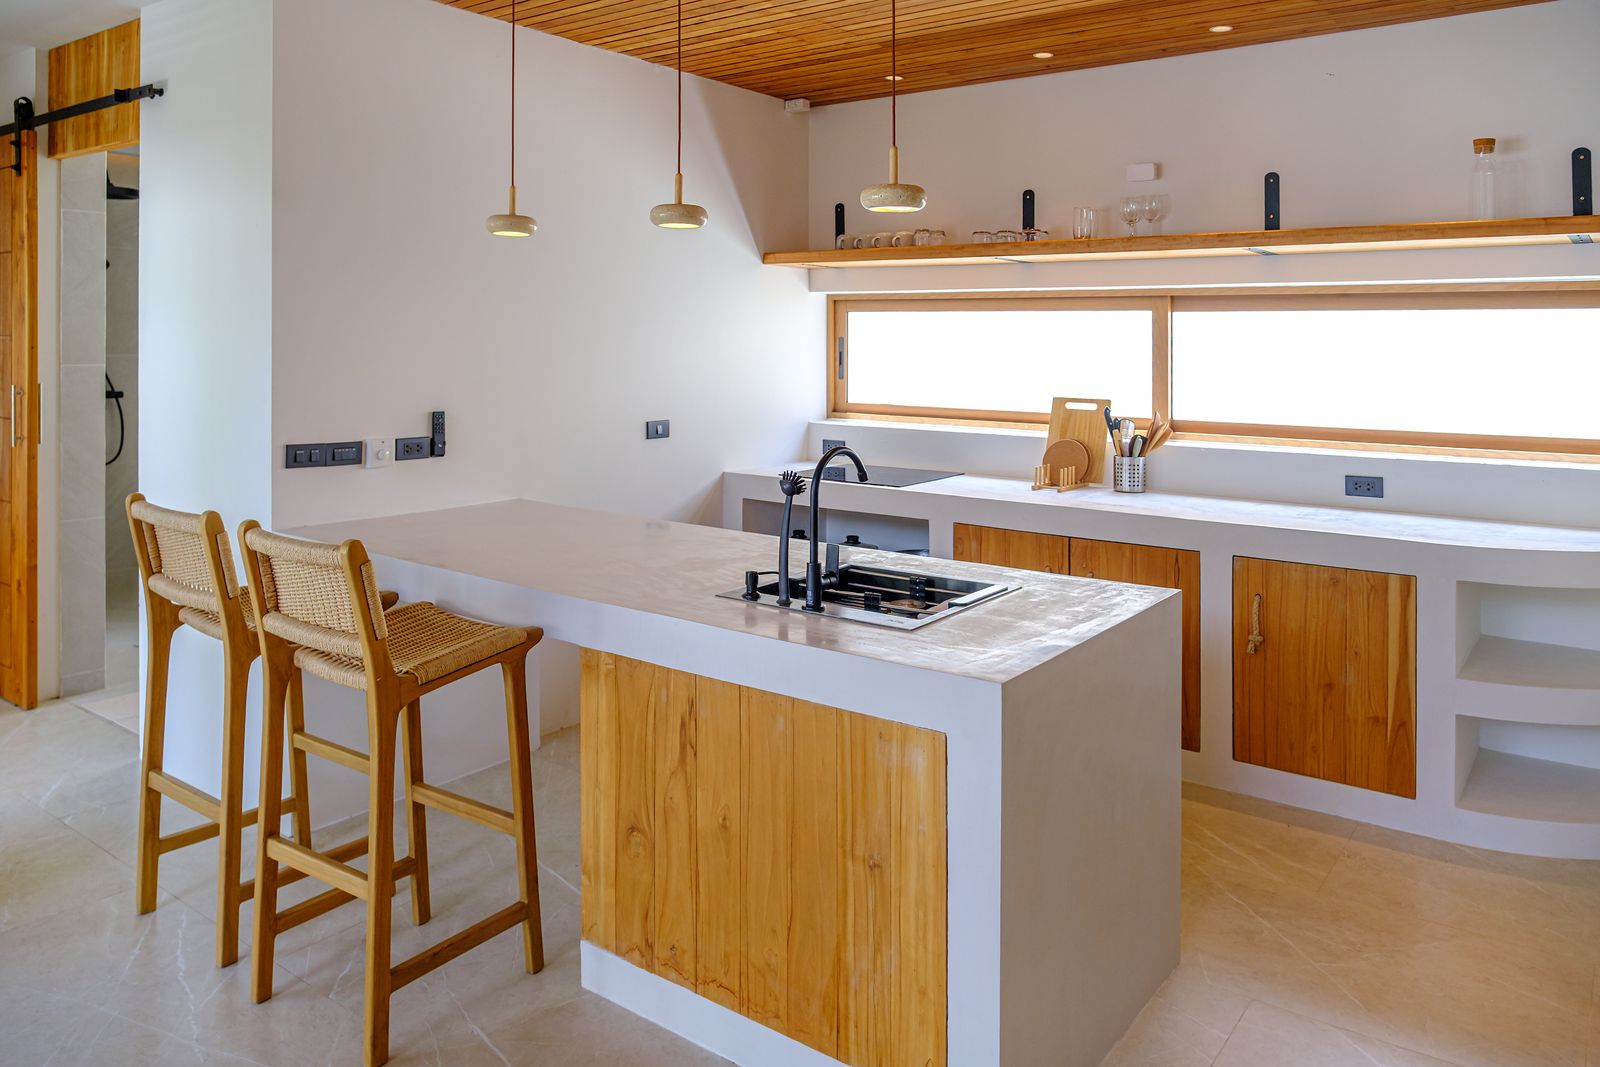
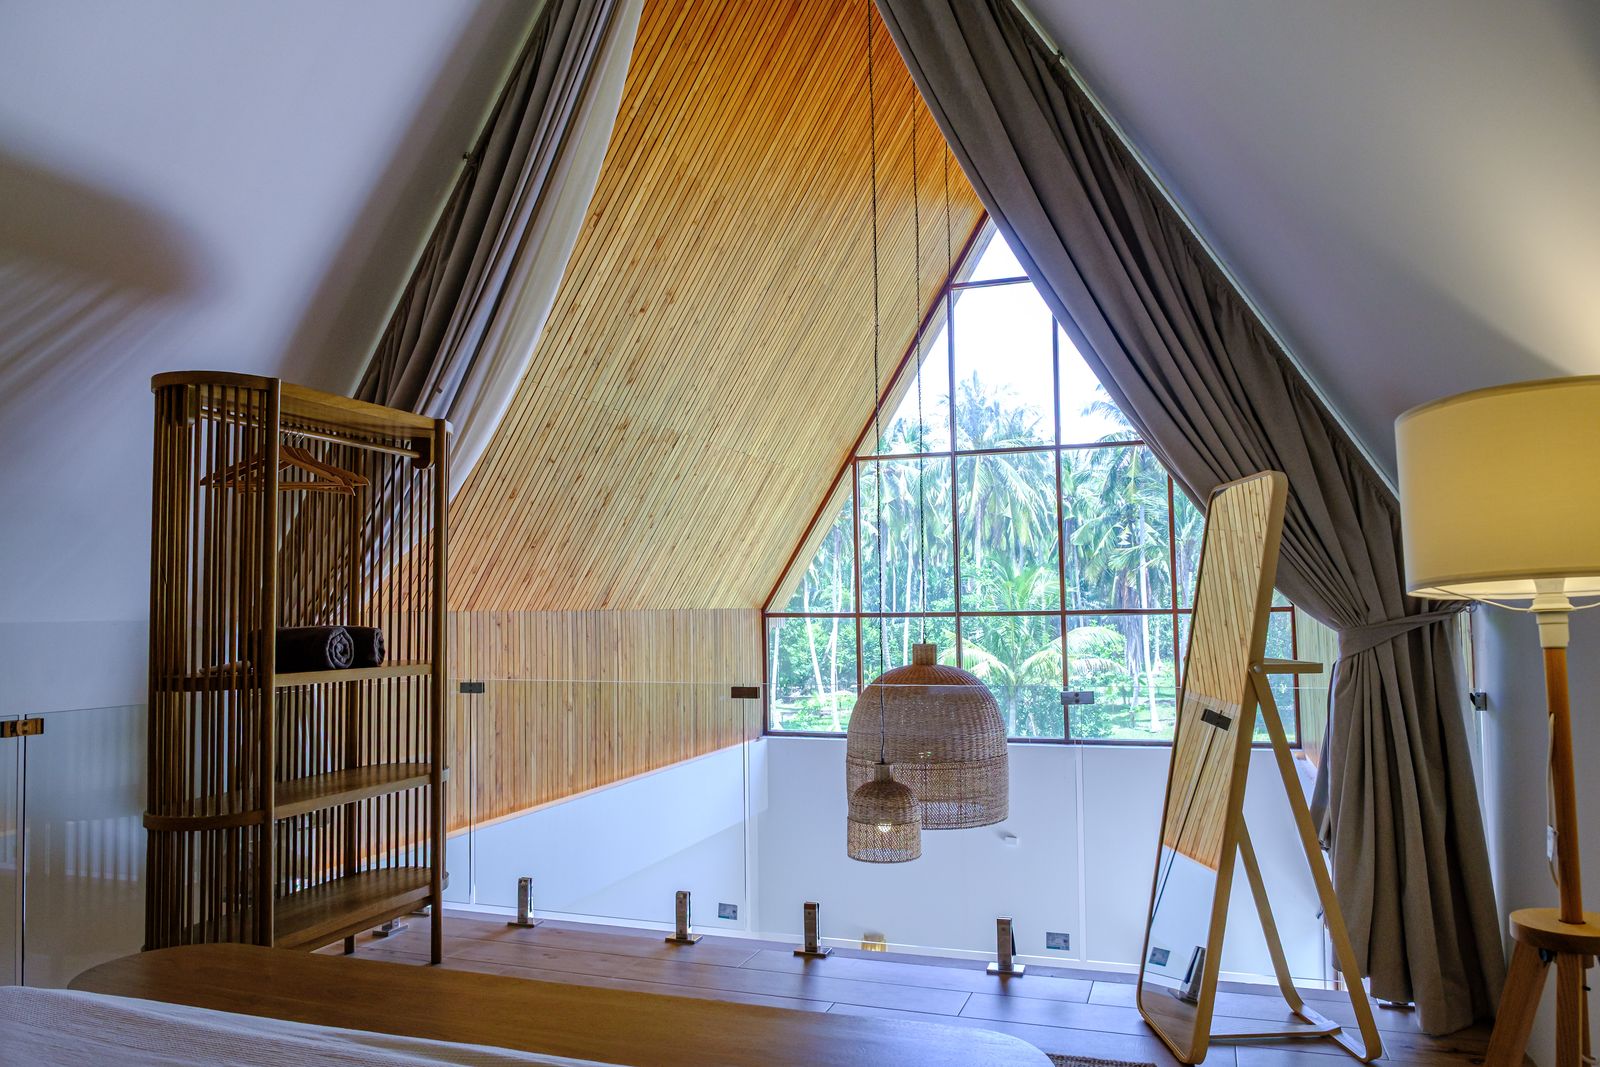
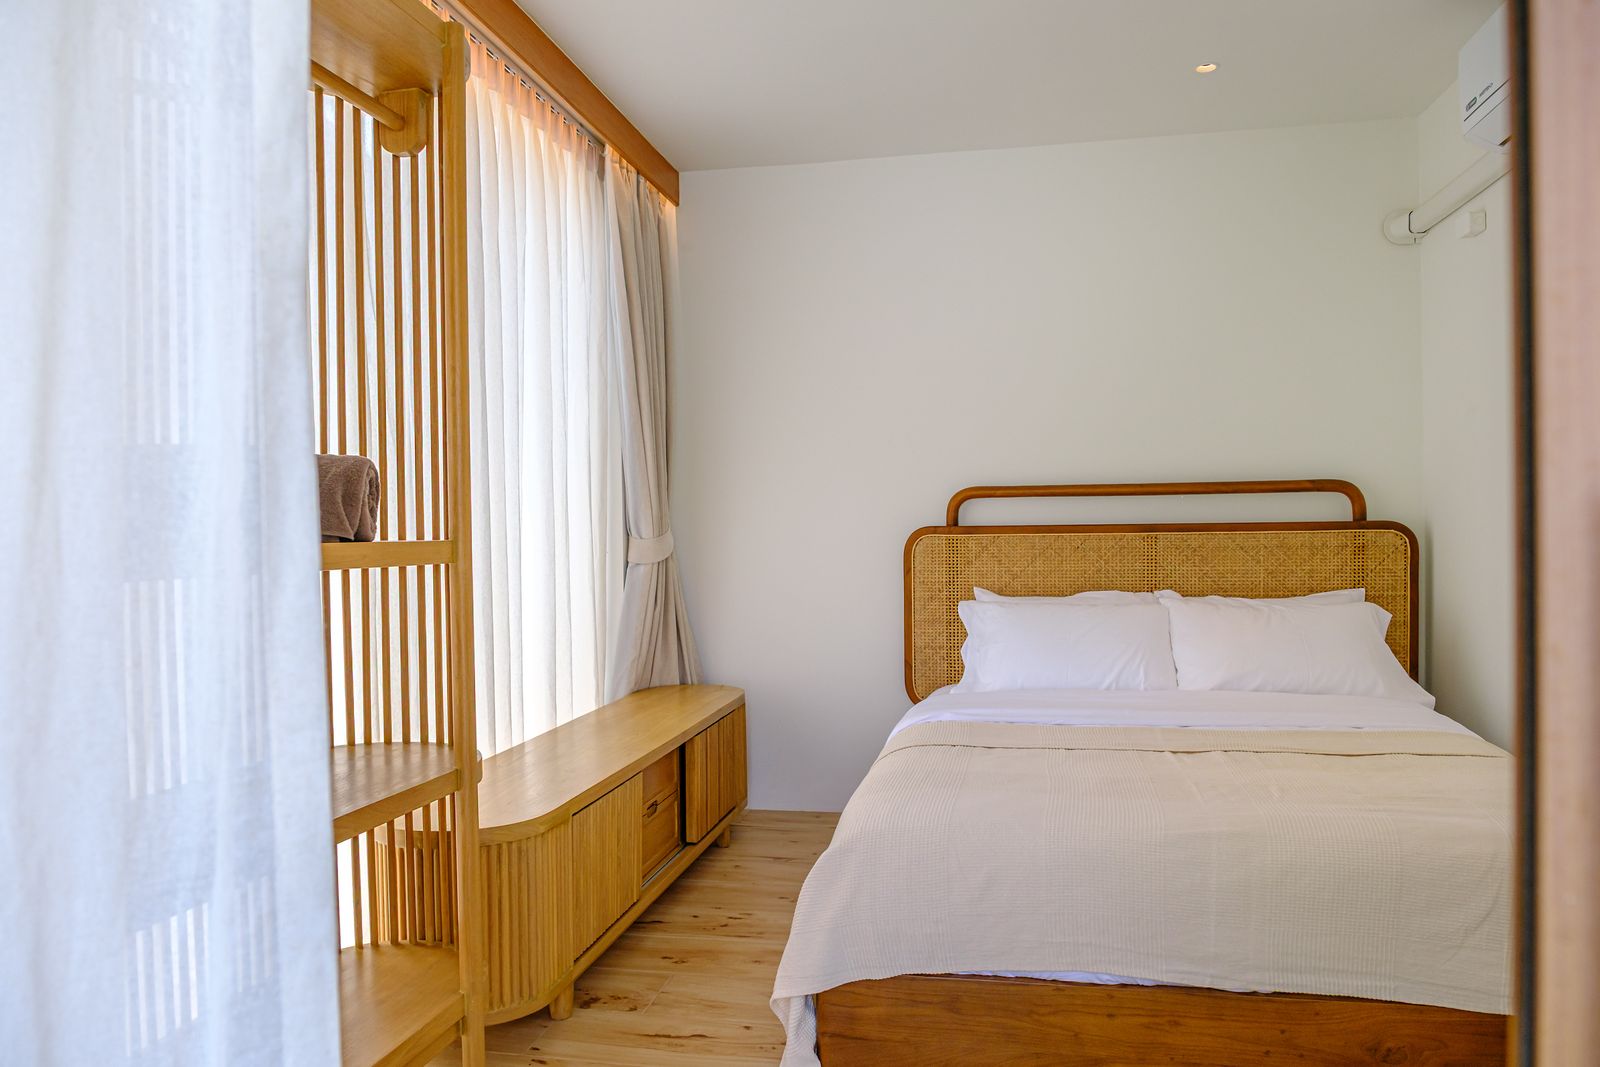
Bedrooms
04
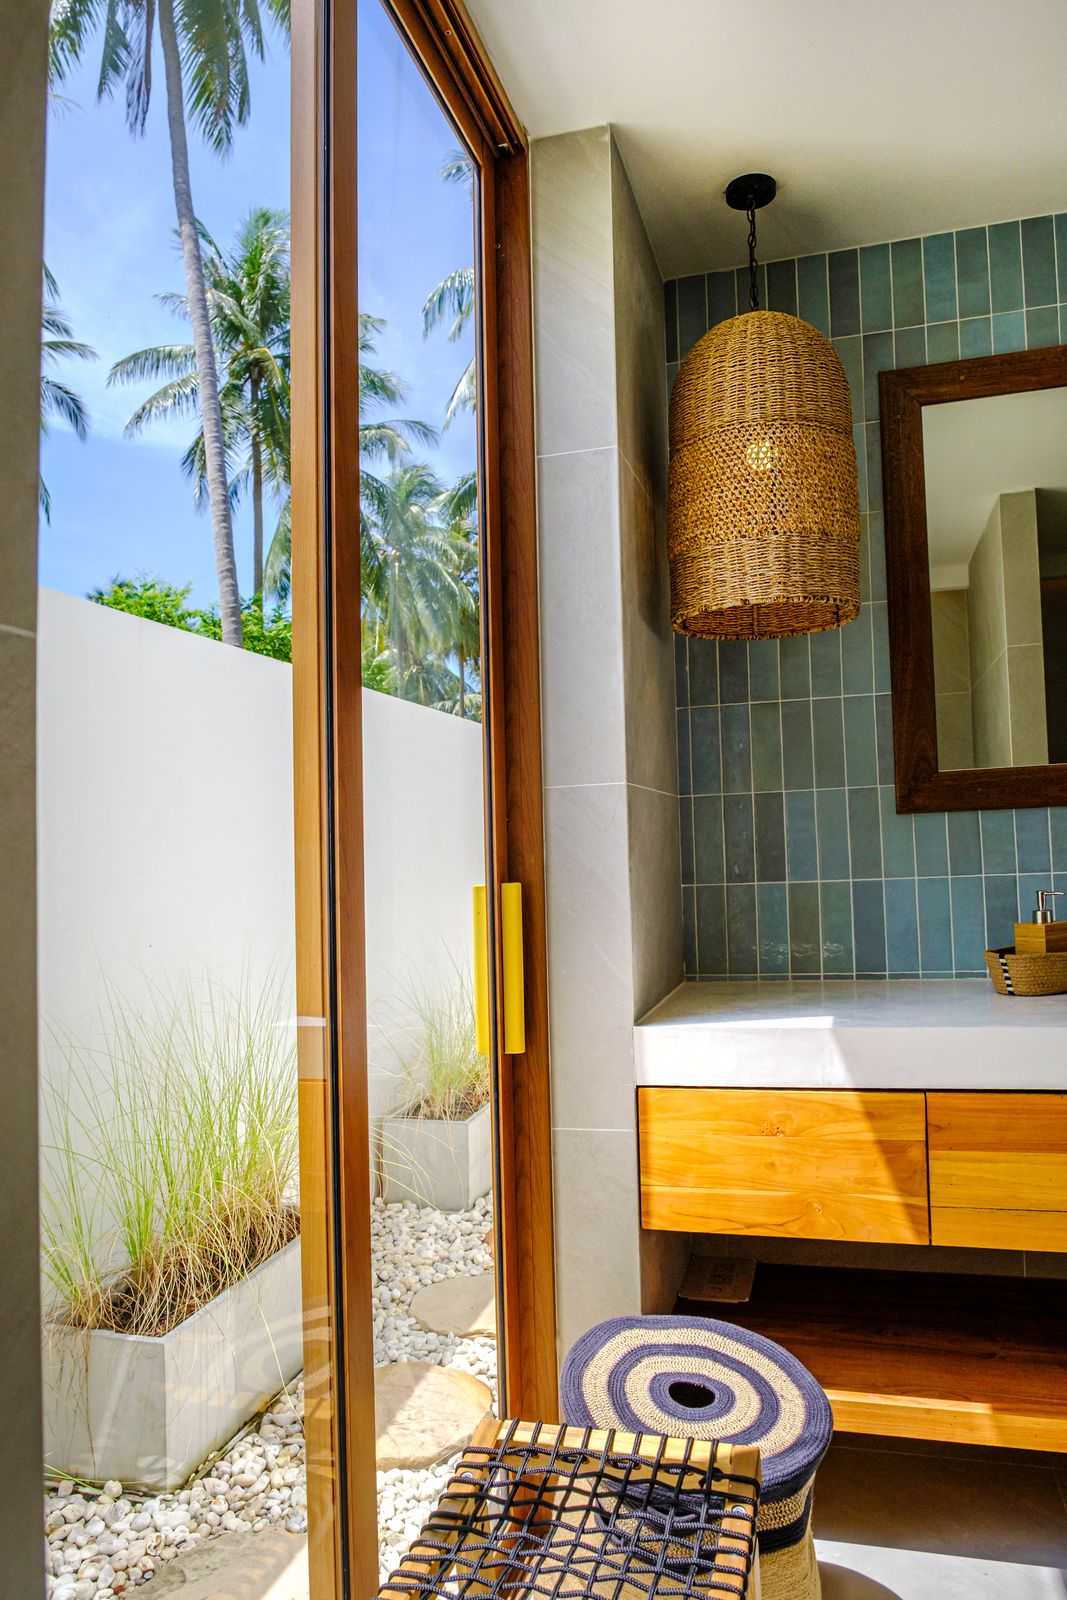
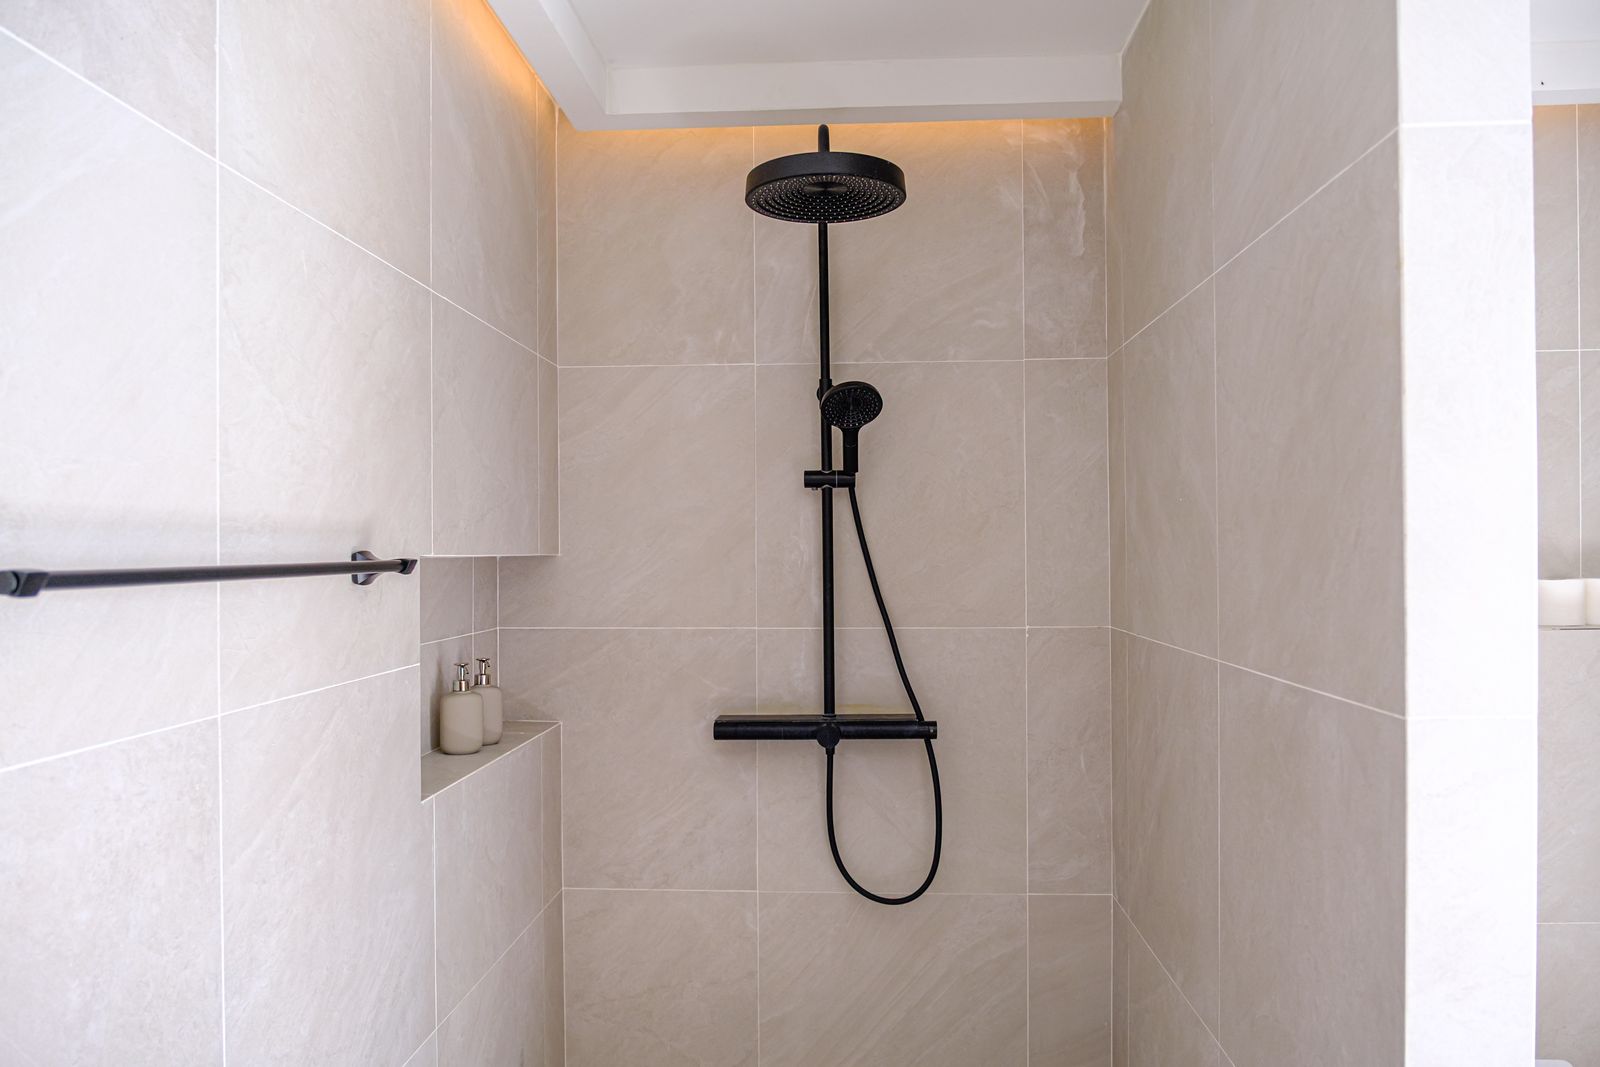
Bathrooms
04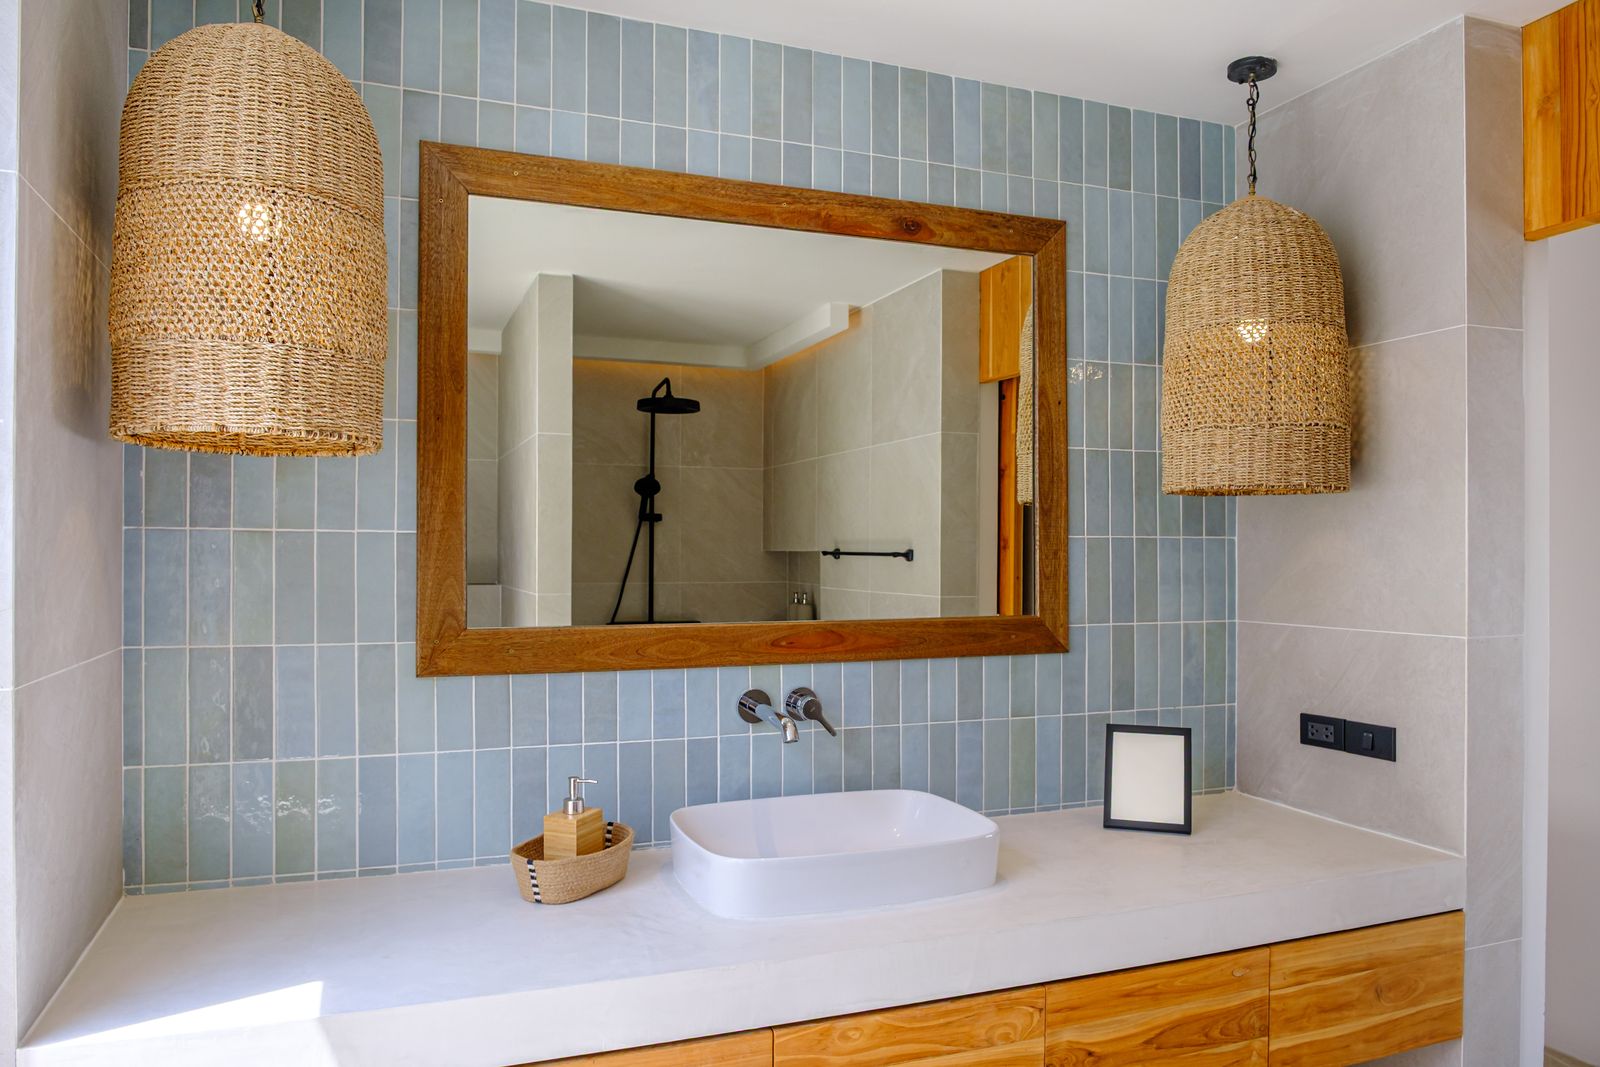
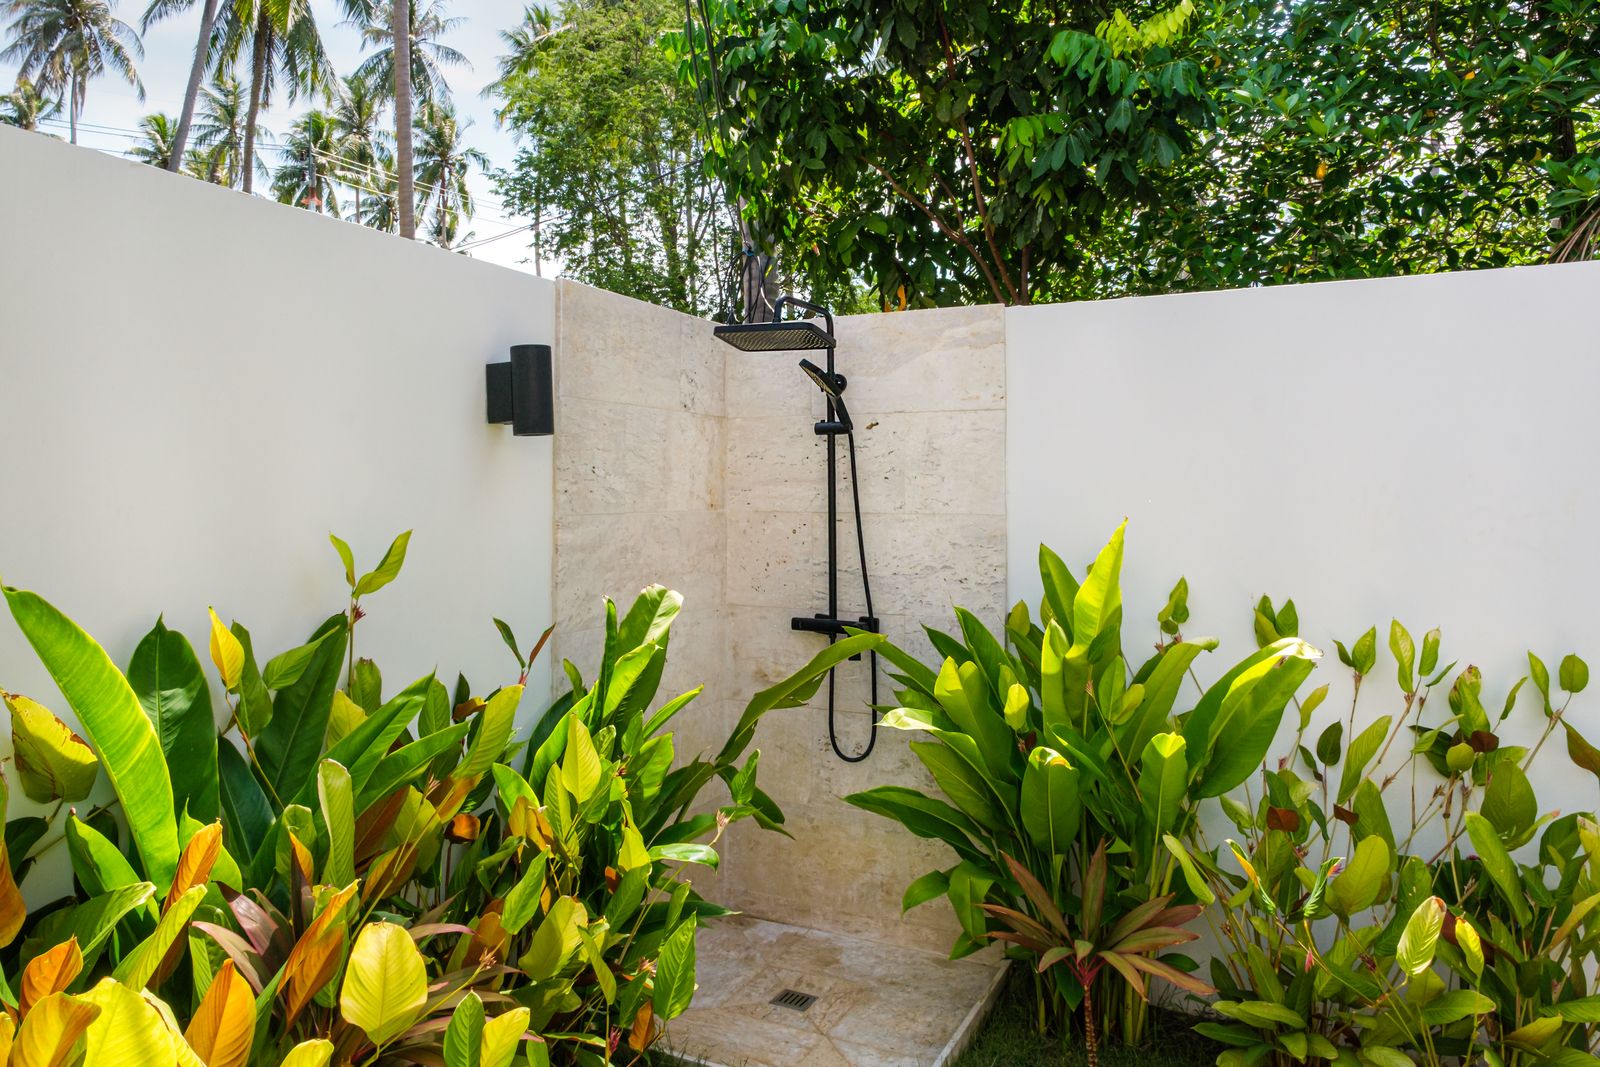
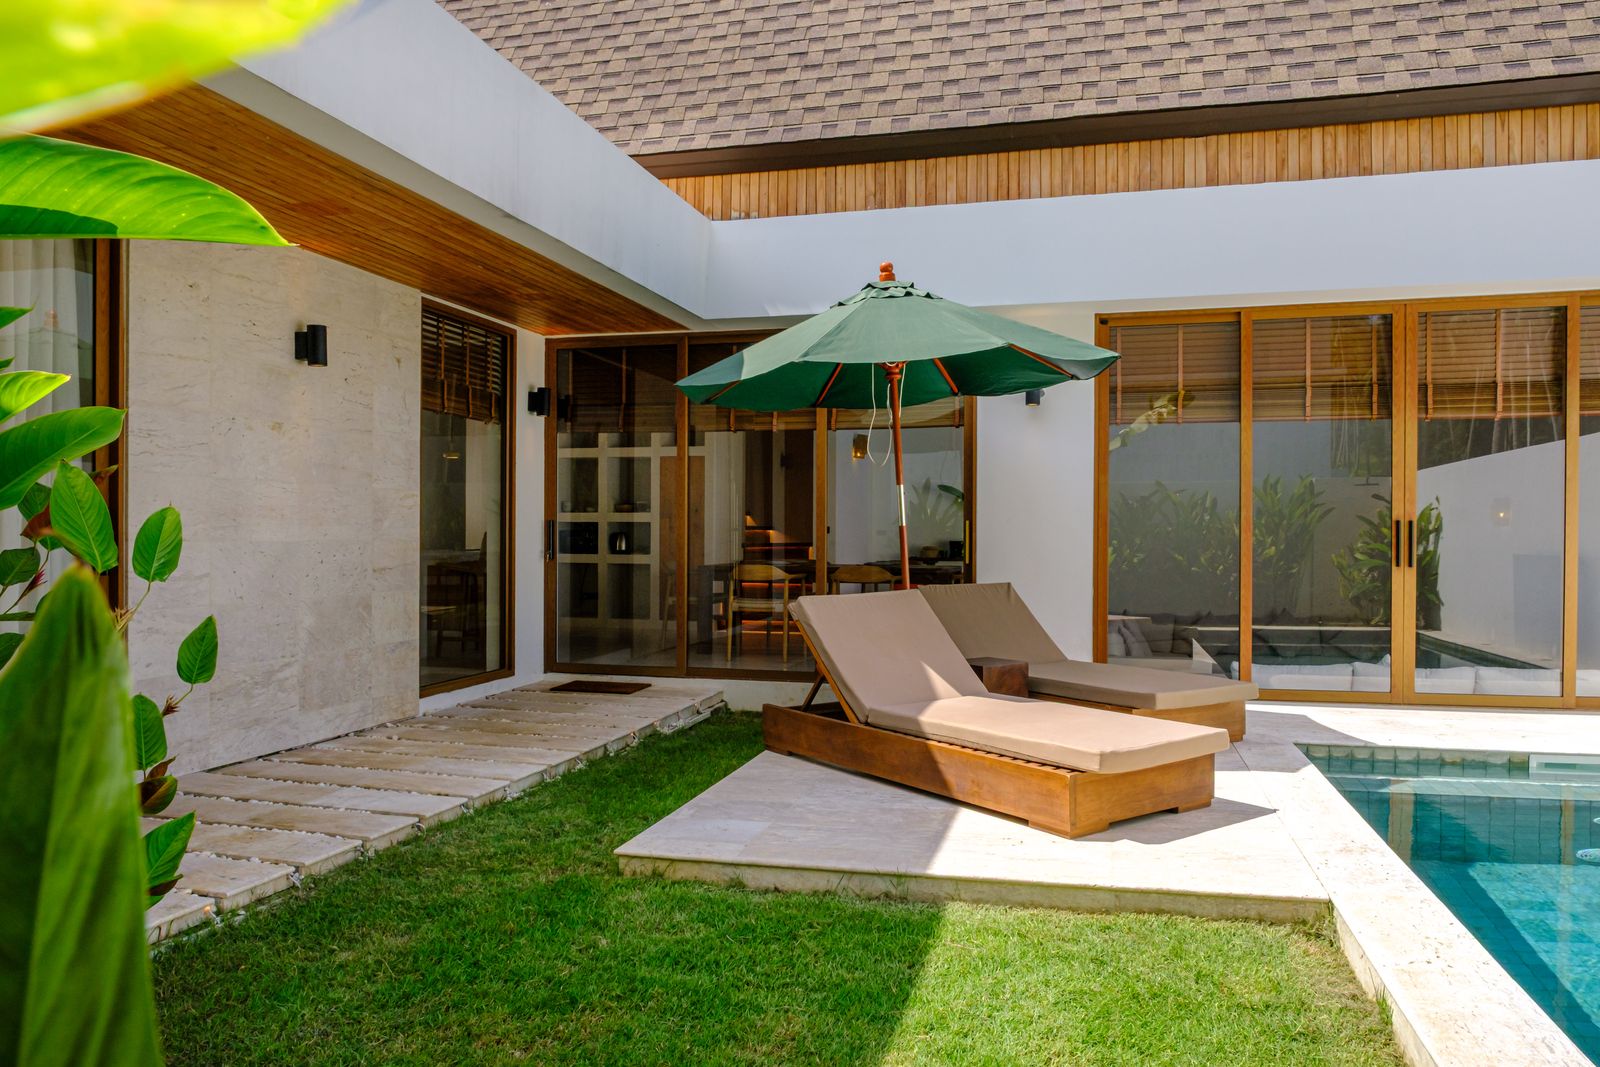
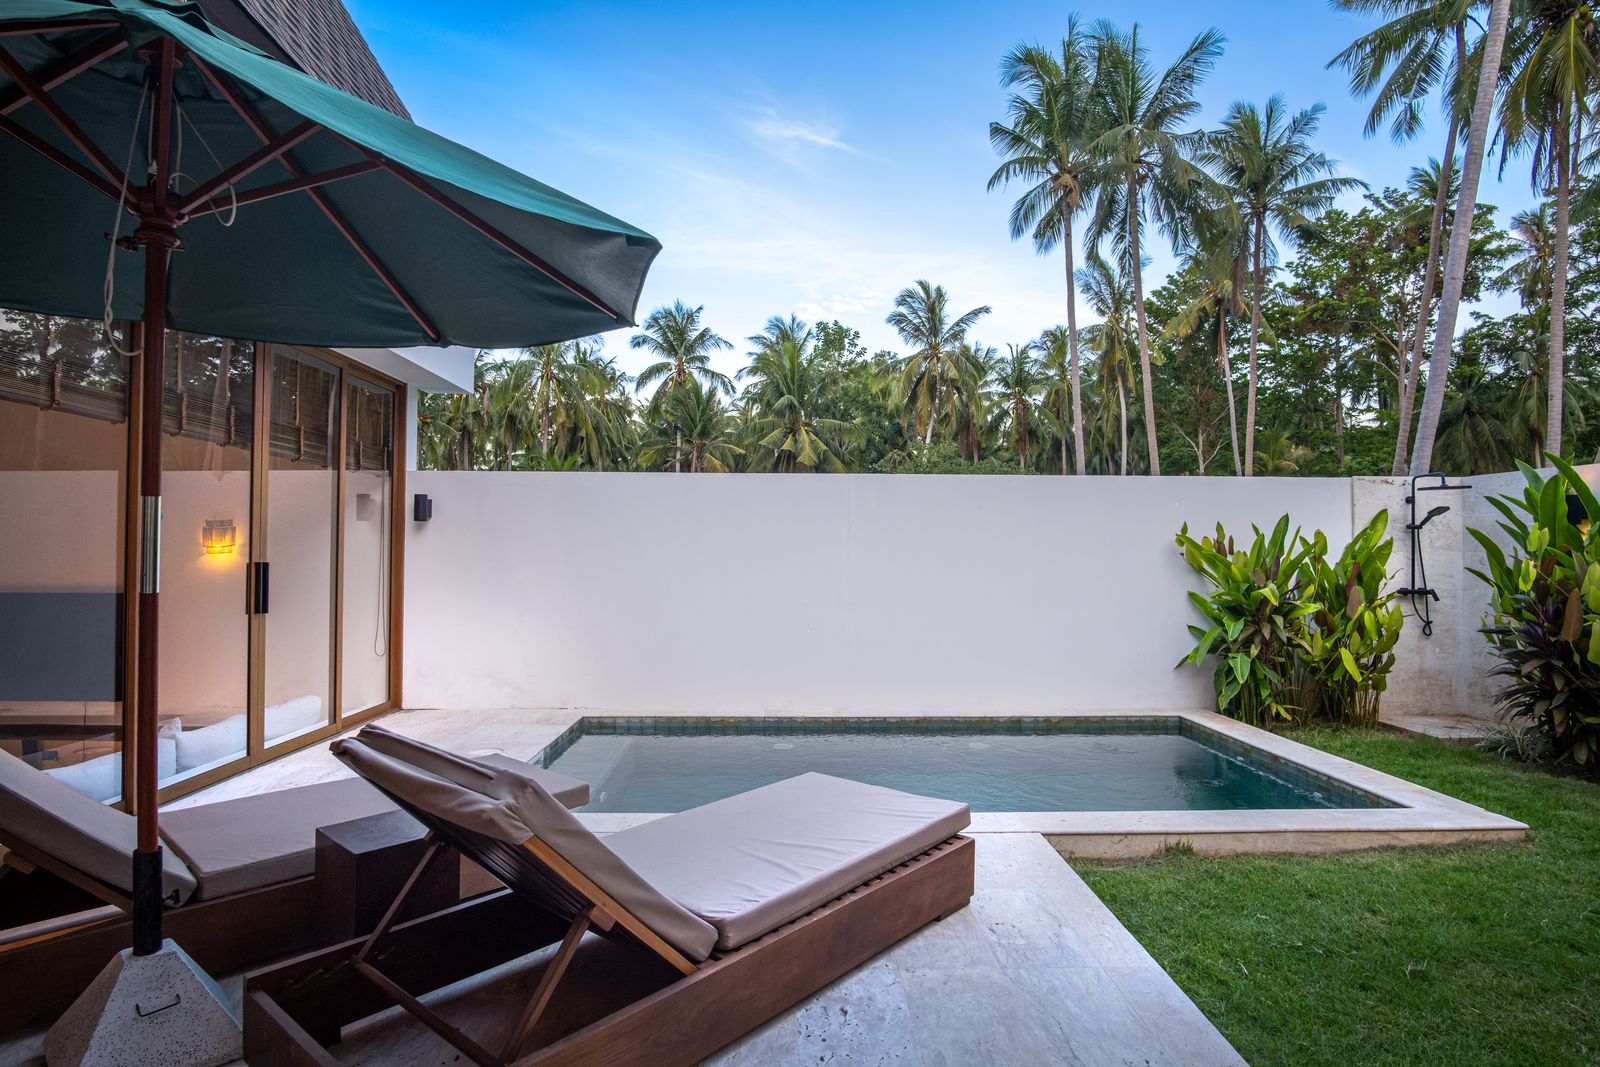
Garden & Pool
06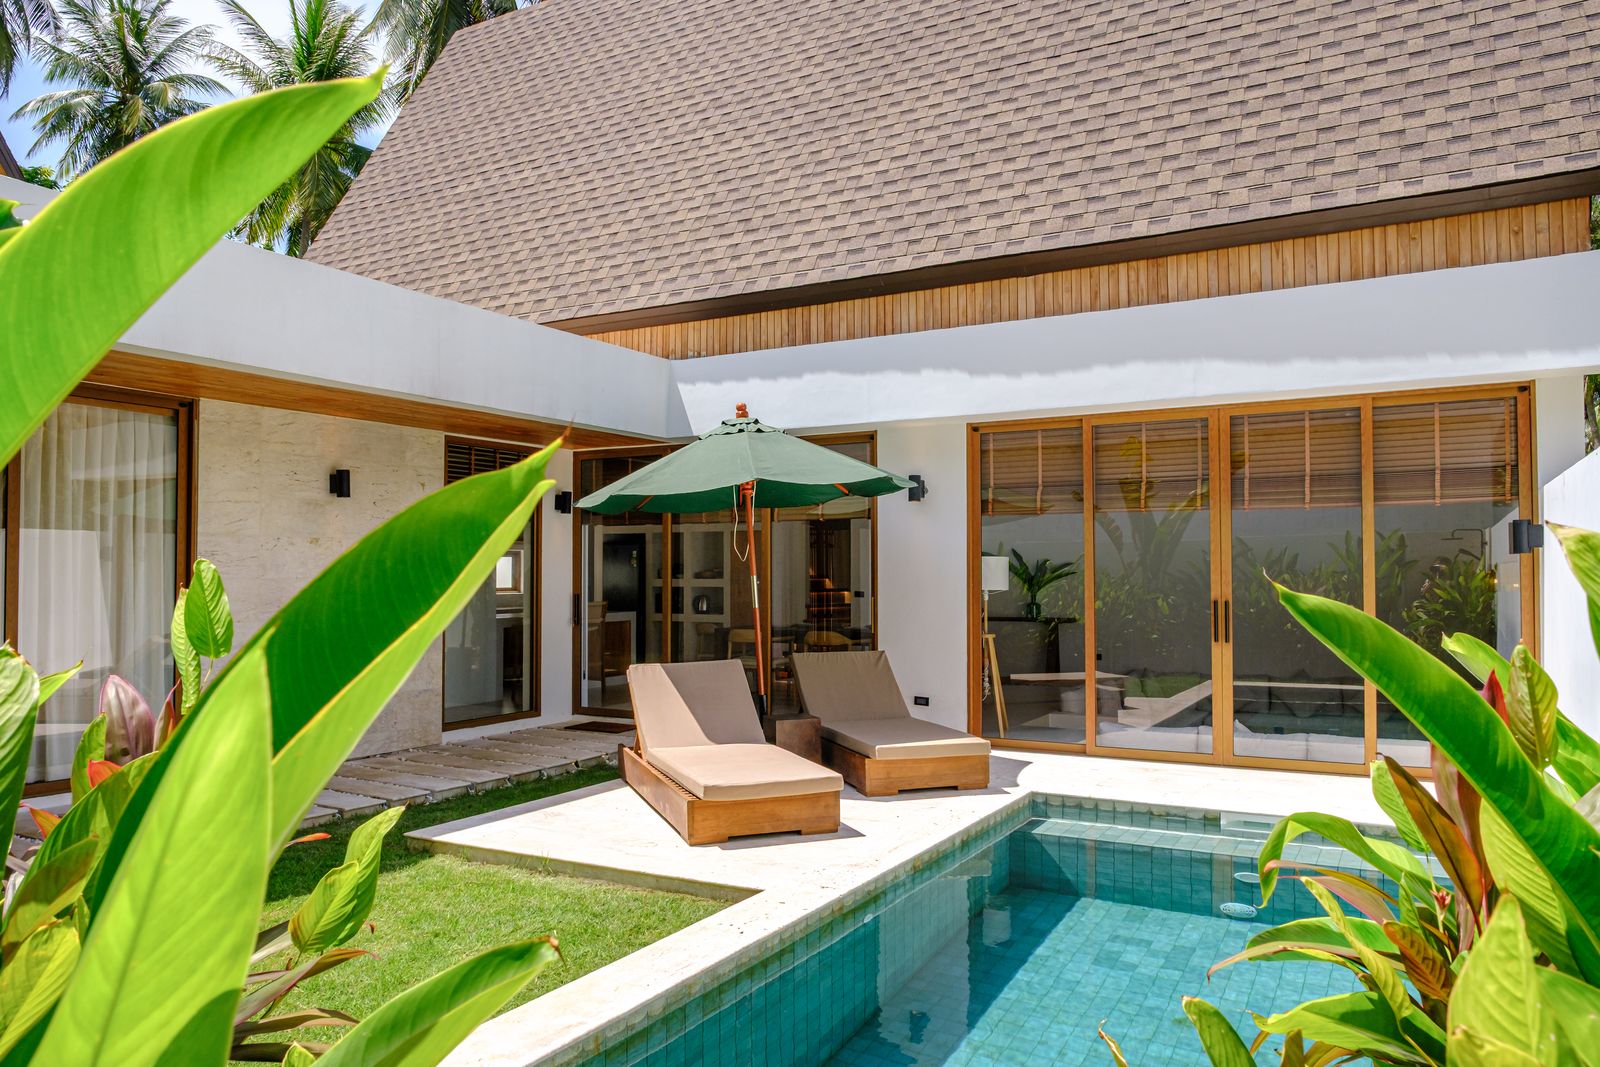
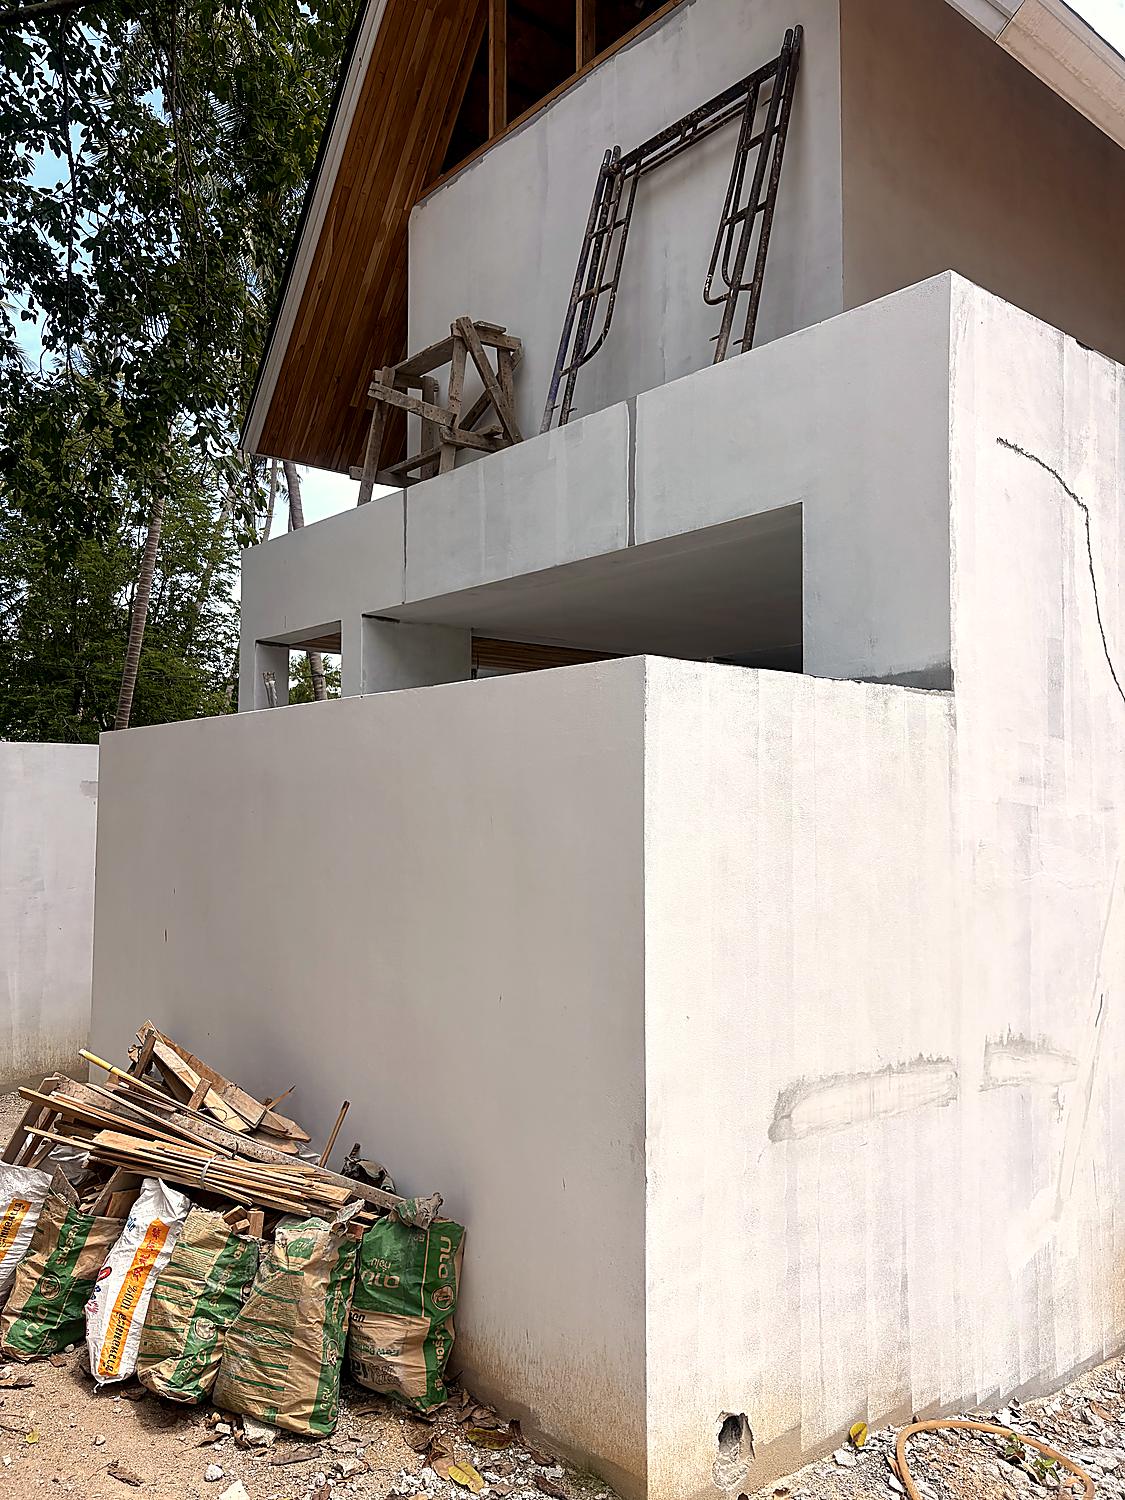
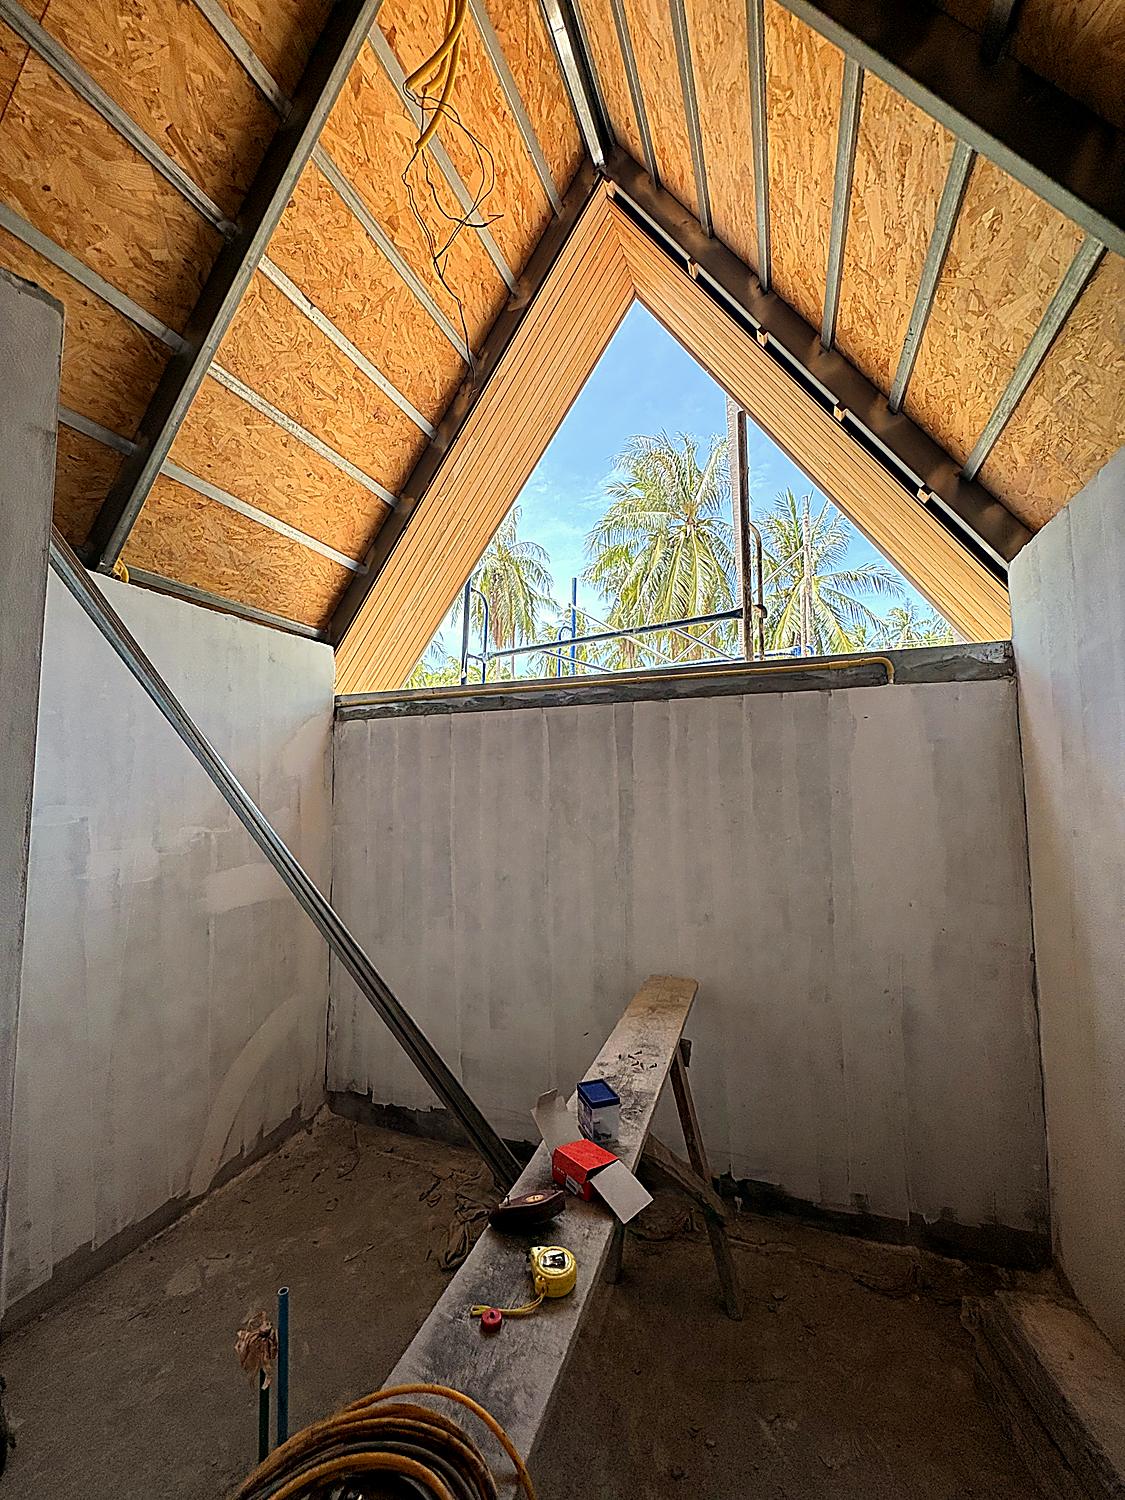
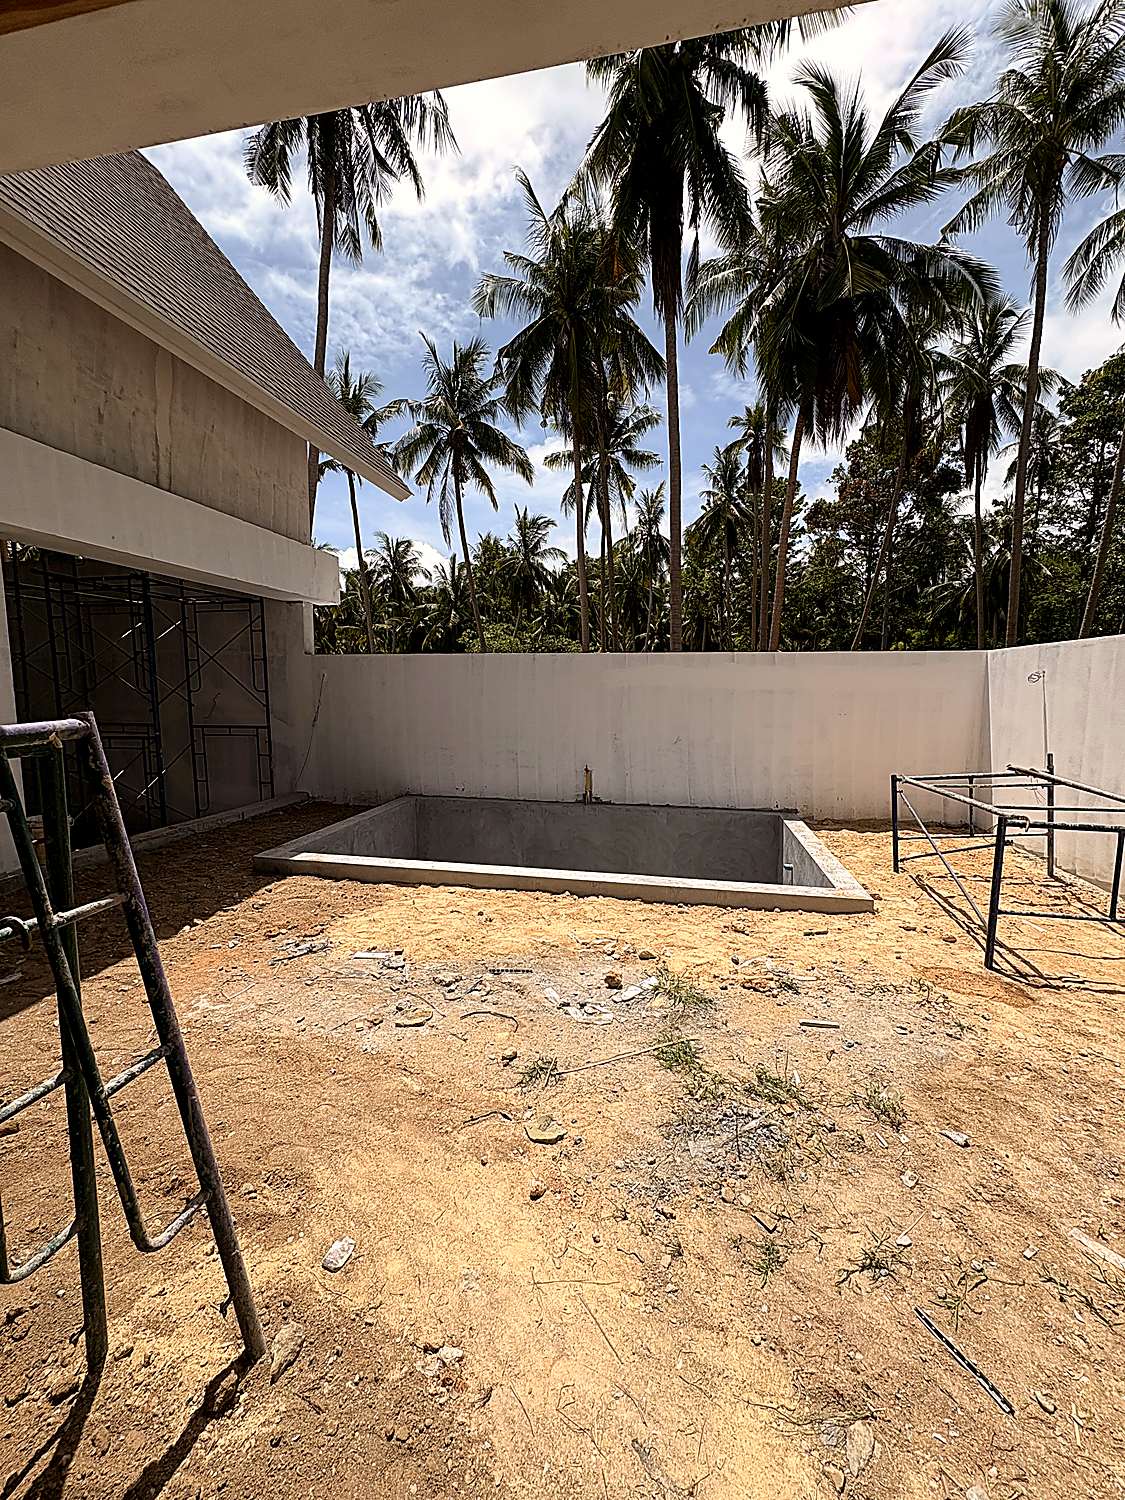
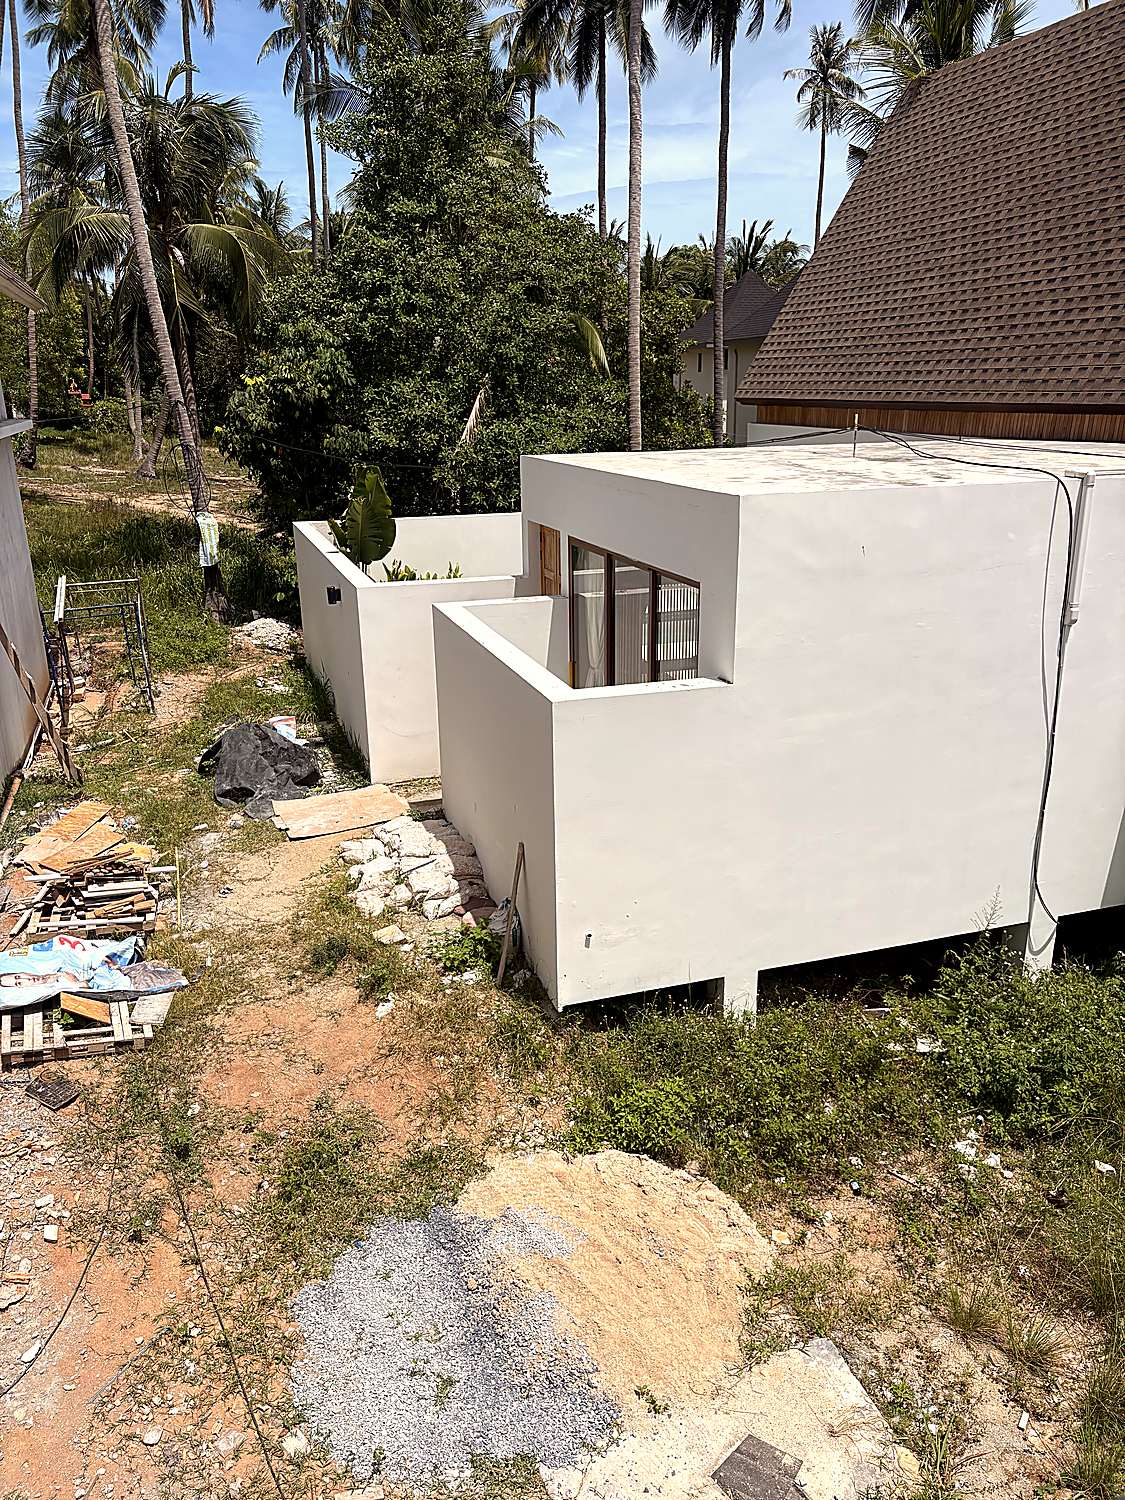
Construction Progress
06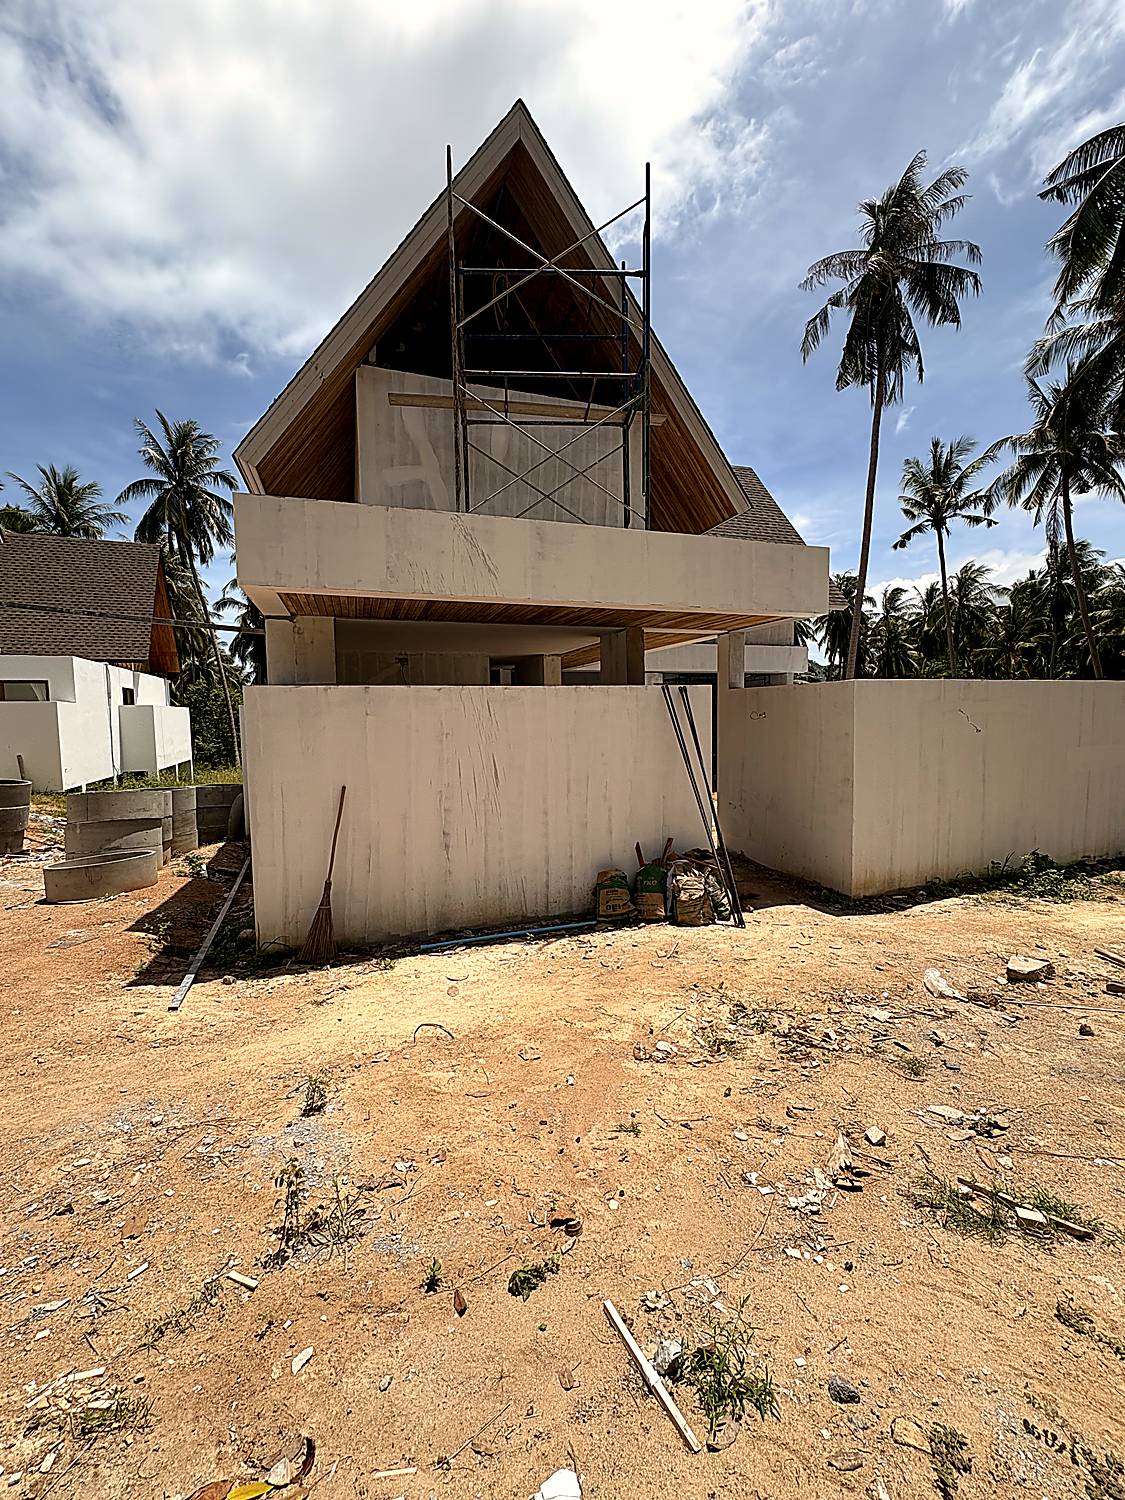
The Place
Now Live on Booking Platforms
See the villas, guest reviews and live availability on each platform.
Location — Koh Phangan, Thailand
→ Open in Google Maps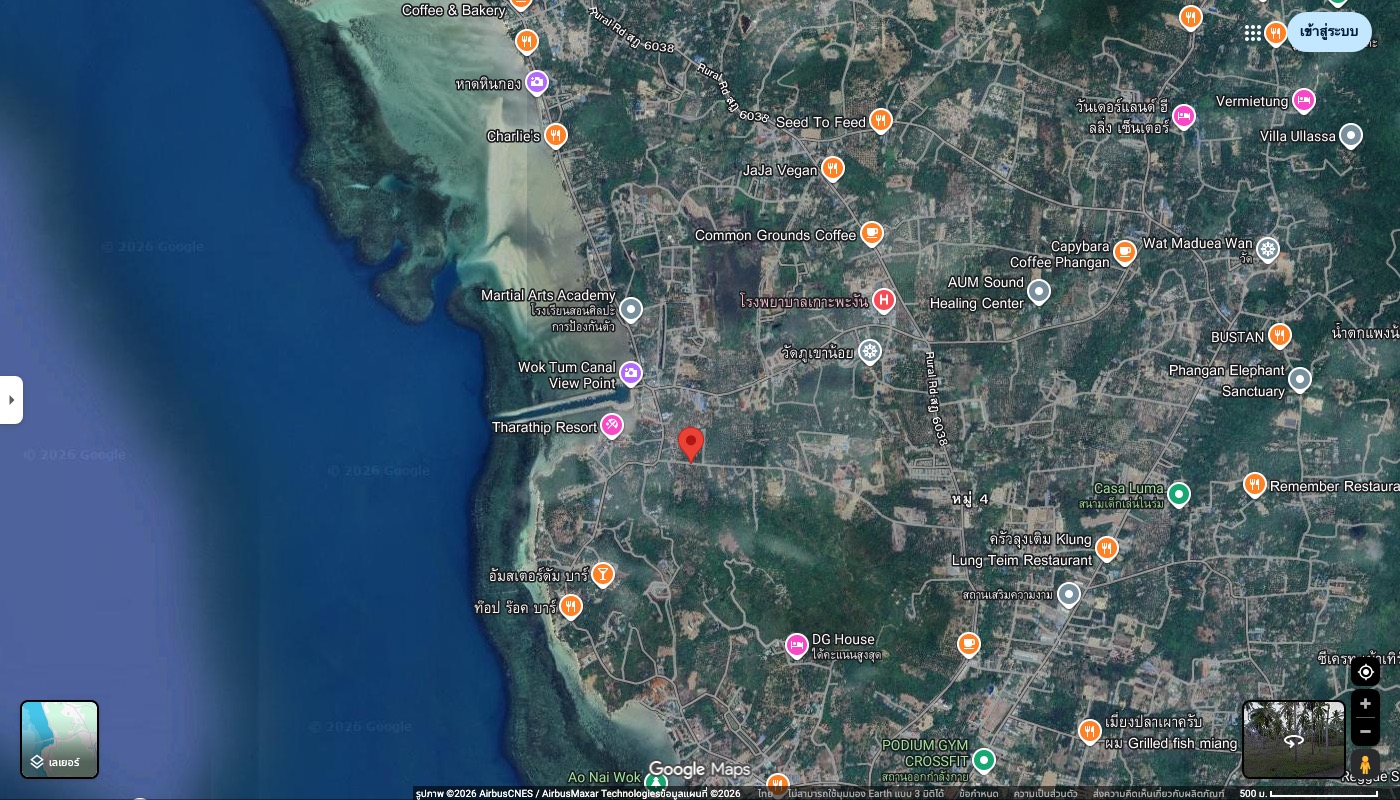

The Film
A walk through mira
Market Data
Comparable Properties — Koh Phangan 2026
9.6 Exceptional · 187 verified reviews
Premium market benchmark
Coconut Lane, Srithanu · 2 min from beach
Direct comparable for Phase 1's ฿9,000 ADR
Hinkong Bay · Koh Phangan
Between mira's ฿9,000 and ฿12,000 tiers
Perfect rating · 20 verified reviews
Benchmark for the ฿12,000 Phase 2–3 tier
Scenario ADR vs. Market — How mira Compares
| Scenario | Fixed ADR (2026) | Occupancy Range | Driver |
|---|---|---|---|
| Conservative | ฿9,000 (P1) / ฿12,000 (P2–3) | 55–60% (2026–2030) | Lower demand; off-peak heavy calendar |
| Base Case | ฿9,000 (P1) / ฿12,000 (P2–3) | 62–70% (2026–2030) | Healthy mixed calendar, solid repeat bookings |
| Optimistic | ฿9,000 (P1) / ฿12,000 (P2–3) | 68–78% (2026–2030) | Strong demand, loyal repeat guests, peak-calendar fill |
ROI Calculator
Model Your Return
Set your investment with the slider (minimum ฿6M, maximum 49% equity) and pick a scenario. The calculator models each phase separately at its own ADR, then blends across all 6 villas — the same model behind every table on this page. Figures are a stabilized year with all 6 villas online, at fixed 2026 ADRs (no growth applied — conservative).
Investment Return Calculator
Net of all fees & costsThe Working — Per Phase, Then Blended
| Phase | Villas | ADR | Occupancy | Gross Revenue | Fees (22%) | Op. Costs | Phase NOI | Standalone Return |
|---|
Assumptions Behind These Numbers
- Occupancy per scenario: Conservative 55% · Base Case 62% · Optimistic 68% — the entry point of each scenario's 2026–2030 range (55–60% / 62–70% / 68–78%), per the market research above
- ADR by phase (fixed 2026 rates): Phase 1 ฿9,000/night minimum · Phase 2 ฿12,000/night · Phase 3 ฿12,000/night — no ADR growth applied in the calculator (the 5-year P&L applies +5%/yr)
- Fees & commissions deducted: 22% of gross revenue — 12% OTA (Airbnb/Booking) + 10% property management
- Operating costs deducted: ฿976K/yr fixed (land lease ฿408K + admin ฿284K + marketing ฿284K) + ฿170K per villa per year variable (utilities, cleaning, maintenance) = ฿2.0M/yr for 6 villas — fixed costs kept at the full-plot level, a conservative assumption
- All returns shown are net (NOI after fees and operating costs), not gross — your dividend is your equity % of NOI
- Blended across 6 villas at two ADR tiers: 2 villas at ฿9,000 and 4 villas at ฿12,000 — Phase 1 alone yields less than the blend; Phases 2–3 yield more
- Stabilized year: assumes all 6 villas operational (Phase 3 complete, from 2028) · gross revenue per phase = ADR × occupancy × 365 × villas
- Equity: your investment ÷ ฿48M valuation (Phases 1–3) · minimum ticket ฿6,000,000 = 12.5% · maximum 49% (฿23,520,000) — founders retain majority ownership
- Pre-opening costs already paid (not deducted, not funded by this raise): project licenses, taxes on the 30-year lease, corporate setup · operating team (cleaning, pool, ground staff) already in place — its ongoing cost is inside the operating costs above
Full Model
Behind the Calculator
Every figure in the calculator comes from this model. Expand any panel for the full working — the same numbers, in detail.
Per-Phase Returns — Stabilized Year, All 6 Villas Online
Same model as the calculator below: fixed 2026 ADR (no growth applied — conservative), net of 22% fees and operating costs. Standalone return = phase NOI ÷ allocated value (฿8M per villa of the ฿48M valuation). Occupancy per scenario: 55% / 62% / 68%.
| Phase | Villas | ADR (2026) | Allocated Value | Conservative (55%) | Base Case (62%) | Optimistic (68%) |
|---|---|---|---|---|---|---|
| Phase 1 | 2 | ฿9,000 | ฿16M | 13.5% | 15.7% | 17.6% |
| Phase 2 | 2 | ฿12,000 | ฿16M | 19.3% | 22.3% | 24.9% |
| Phase 3 | 2 | ฿12,000 | ฿16M | 19.3% | 22.3% | 24.9% |
| Blended — 6 villas | 6 | ฿9K–12K | ฿48M | 17.4% | 20.1% | 22.5% |
Phase 1 alone returns 13.5% in the conservative scenario — below 15% at its ฿9,000 minimum ADR. That is expected: 4 of the 6 villas run at the ฿12,000 tier, lifting the blended return above 15% in every scenario. Break-even occupancy for a 15% blended return is 48.9%.
Full 5-Year P&L Model — 2026 to 2030 (three scenarios)
Already paid, not deducted below and not funded by this raise: pre-opening costs for the whole project — licenses, taxes on the 30-year lease, corporate setup. The operating team (cleaning, pool, ground staff) is already in place; its ongoing cost is inside the fixed + per-villa operating costs above.
| Year | Villas | Occ. | ADR (P1 / P2–3) | Gross Revenue | Fees & Comm. (22%) | Net Revenue | Operating Costs | NOI |
|---|---|---|---|---|---|---|---|---|
| 2026 | 2 Aug +2 Oct | 55% | ฿9.0K / ฿12.0K | ฿2.7M | (฿0.6M) | ฿2.1M | (฿1.2M) | ฿0.9M |
| 2027 | 4 | 57% | ฿9.5K / ฿12.6K | ฿9.2M | (฿2.0M) | ฿7.2M | (฿1.7M) | ฿5.5M |
| 2028 | 6 | 58% | ฿9.9K / ฿13.2K | ฿15.4M | (฿3.4M) | ฿12.0M | (฿2.0M) | ฿10.0M |
| 2029 | 6 | 59% | ฿10.4K / ฿13.9K | ฿16.5M | (฿3.6M) | ฿12.8M | (฿2.0M) | ฿10.8M |
| 2030 | 6 | 60% | ฿10.9K / ฿14.6K | ฿17.6M | (฿3.9M) | ฿13.7M | (฿2.0M) | ฿11.7M |
| 5-Year Cumulative NOI → | ฿39.0M | |||||||
| Year | Villas | Occ. | ADR (P1 / P2–3) | Gross Revenue | Fees & Comm. (22%) | Net Revenue | Operating Costs | NOI |
|---|---|---|---|---|---|---|---|---|
| 2026 | 2 Aug +2 Oct | 62% | ฿9.0K / ฿12.0K | ฿3.1M | (฿0.7M) | ฿2.4M | (฿1.2M) | ฿1.2M |
| 2027 | 4 | 65% | ฿9.5K / ฿12.6K | ฿10.5M | (฿2.3M) | ฿8.2M | (฿1.7M) | ฿6.5M |
| 2028 | 6 | 67% | ฿9.9K / ฿13.2K | ฿17.8M | (฿3.9M) | ฿13.9M | (฿2.0M) | ฿11.9M |
| 2029 | 6 | 68% | ฿10.4K / ฿13.9K | ฿19.0M | (฿4.2M) | ฿14.8M | (฿2.0M) | ฿12.8M |
| 2030 | 6 | 70% | ฿10.9K / ฿14.6K | ฿20.5M | (฿4.5M) | ฿16.0M | (฿2.0M) | ฿14.0M |
| 5-Year Cumulative NOI → | ฿46.4M | |||||||
| Year | Villas | Occ. | ADR (P1 / P2–3) | Gross Revenue | Fees & Comm. (22%) | Net Revenue | Operating Costs | NOI |
|---|---|---|---|---|---|---|---|---|
| 2026 | 2 Aug +2 Oct | 68% | ฿9.0K / ฿12.0K | ฿3.4M | (฿0.7M) | ฿2.6M | (฿1.2M) | ฿1.4M |
| 2027 | 4 | 72% | ฿9.5K / ฿12.6K | ฿11.6M | (฿2.5M) | ฿9.0M | (฿1.7M) | ฿7.4M |
| 2028 | 6 | 74% | ฿9.9K / ฿13.2K | ฿19.7M | (฿4.3M) | ฿15.3M | (฿2.0M) | ฿13.3M |
| 2029 | 6 | 76% | ฿10.4K / ฿13.9K | ฿21.2M | (฿4.7M) | ฿16.5M | (฿2.0M) | ฿14.5M |
| 2030 | 6 | 78% | ฿10.9K / ฿14.6K | ฿22.8M | (฿5.0M) | ฿17.8M | (฿2.0M) | ฿15.8M |
| 5-Year Cumulative NOI → | ฿52.5M | |||||||
Year-5 (2030) Comparison
| Metric | Conservative | Base Case | Optimistic |
|---|---|---|---|
| Occupancy (Y5) | 60% | 70% | 78% |
| Y5 Gross Revenue | ฿17.6M | ฿20.5M | ฿22.8M |
| Y5 NOI | ฿11.7M | ฿14.0M | ฿15.8M |
| 5-Yr Cumulative NOI | ฿39.0M | ฿46.4M | ฿52.5M |
Quarterly Dividend Schedule & Capital Return
Quarterly dividends begin in Year 1 (Phase 1 opens 1 August 2026) and step up sharply once all 6 villas come online in 2028. Through dividend income alone, ≈97% of your initial investment is recovered within 5 years (base case), with full recovery in early Year 6 — every quarter thereafter is pure net gain, for the remaining life of the 30-year leasehold.
Your Annual & Quarterly Dividends — Base Case
Dividend = your equity % of annual NOI, paid quarterly. Based on the base case scenario (฿9,000/฿12,000 fixed 2026 ADR by phase, 62–70% occupancy, +5%/yr ADR growth) for the minimum ฿6M ticket. Larger tickets scale pro-rata.
| Year | Portfolio NOI | Annual Dividend | Per Quarter | Cash-on-Cash Yield | Cumulative Received |
|---|---|---|---|---|---|
| 2026 | ฿1.2M | ฿149K | ฿37K | 2.5% | ฿149K |
| 2027 | ฿6.5M | ฿813K | ฿203K | 13.6% | ฿963K |
| 2028 | ฿11.9M | ฿1.49M | ฿371K | 24.8% | ฿2.45M |
| 2029 | ฿12.8M | ฿1.60M | ฿400K | 26.7% | ฿4.05M |
| 2030 | ฿14.0M | ฿1.75M | ฿437K | 29.1% | ฿5.80M |
| 5-Year cumulative dividend income → | ฿5.80M | ||||
฿5.80M received in 5 years via dividends on a ฿6M ticket (base case) — ≈97% of capital recovered, with full recovery in early 2031. Conservative case: ~฿4.9M in dividends by Year 5. Optimistic: ~฿6.6M. 2026 is a partial year (Phase 1 from August, Phase 2 from October); the step-up comes when Phase 3's 2 villas open in 2028.
A Note on Capital Return & Exit
What this means practically: treat this as a long-term income asset — similar to owning a share in a productive property portfolio. Dividends build year over year. Capital is preserved in the underlying real assets. Potential upside on any future sale — but no exit guarantee and no fixed timeline. Invest with a long-term horizon.
Use of Funds
Building Phase 3 — 2 Villas to Complete the First Half
Phase 3 — Budget Breakdown (2 Villas, Estimated)
| Line Item | Amount | % |
|---|---|---|
| Construction — 2 villas, Phase-2 format | ฿7,800,000 | 84.8% |
| Furniture & fit-out | ฿900,000 | 9.8% |
| Landscape, lighting & pool areas | ฿250,000 | 2.7% |
| Operational setup (booking, PMS, photography) | ฿150,000 | 1.6% |
| Working capital & contingency reserve | ฿100,000 | 1.1% |
| Total Phase 3 Cost (est.) | ฿9,200,000 | 100% |
Estimated from actual build costs to date. Phase 2–3 villas use the larger format with an extra bathroom and cost more per villa to build than Phase 1 — the estimate reflects the larger-format cost; the final budget is confirmed at contractor signing. All project-level pre-opening costs (licenses, 30-year lease taxes, corporate setup) are already paid and are not part of this budget.
The Endgame
Phase 4 — The Second Half of the Land
Risks
Key Risks & Mitigations
Occupancy Underperformance
Conservative at 55% sits well below top-performer benchmarks (68–73%). Fixed per-phase ADRs mean scenario differentiation is occupancy-only — a more honest risk metric than blended pricing. Break-even occupancy for a 15% blended return: 48.9%.
Construction Timeline Risk
Phase 2 targets October 2026 (85% complete); Phase 3 takes ≈1 year from construction start and has not yet begun. Any delay pushes revenue by one season. Contingency buffer included. Experienced local contractors.
Supply Competition
1,514% YoY new listings growth on Koh Phangan (AirROI). Luxury private-pool positioning and new construction differentiate mira from mass-market entrants.
FX / Currency Risk
All revenues in THB. International investors face FX risk on repatriation. Thai Baht relatively stable; strong tourism macros support currency fundamentals.
Leasehold Structure
30-year leasehold — the standard vehicle for foreign investment in Thai real estate. At Year 15, founders renegotiate the lease; project continuity depends on their decision at that time. Legal reviewed by local Thai counsel.
Liquidity Risk
This is a long-term income asset. Capital is not returned on a fixed schedule — exit occurs only via a future portfolio sale or secondary share transfer at the founders' discretion. Invest with a long-term horizon.